FIGURES
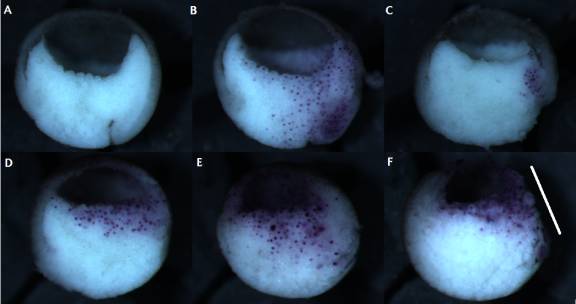
Figure 1: Preliminary trial of DN-XRhoA microinjection. Un-injected control (A); control embryo injected with only 200pg/blas. β-Gal mRNA (B); embryo injected with 184pg/blas. DN-Rho mRNA (C); embryo injected with 368pg/blas. DN-Rho RNA (D); embryo injected with 552pg/blas. DN-Rho RNA (E); embryo injected with 552pg/blas. DN-Rho RNA showing extensive cell death and necrosis (F, see along the white bar). All DN-Rho RNA-injected embryos were also injected with 200pg/blas. β-Gal mRNA.
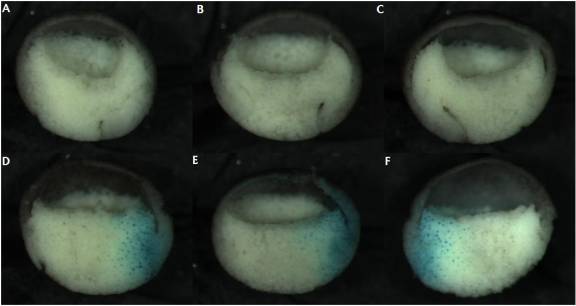
Figure 2: Second trial of DN-XRhoA microinjection. Un-injected controls (A-C); embryos injected with 250pg/blas. DN-Rho mRNA along with 200pg/blas. β-Gal mRNA (D-F).
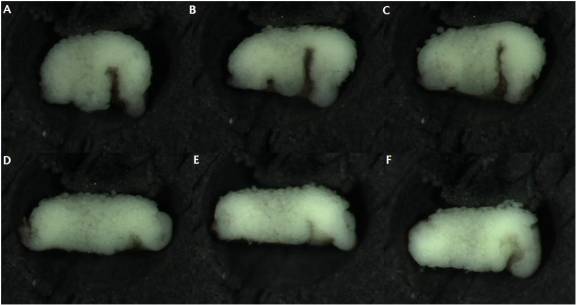
Figure 3: ROK-inhibitor treatment of BCR-less embryos. Embryos kept in 1X MBS after BCR removal at stage 10-, for 1.5 hours (A-C); embryos kept in 1X MBS containing ROK-inhibitor, after BCR removal at stage 10-, for 1.5 hours (D-F).
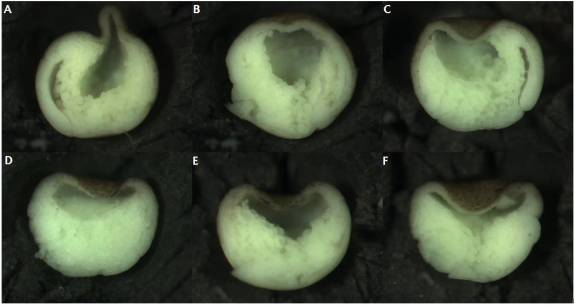
Figure 4: ROK-inhibited embryos kept in ficoll until fixation. Un-injected control embryos (A-C); embryos injected into the blastocoel with 11.5nl ROK inhibitor at stage 9 (D-F).
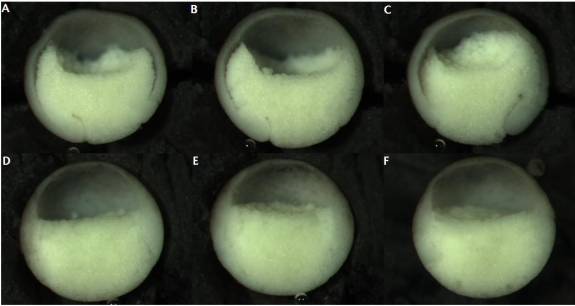
Figure 5: ROK-inhibited embryos allowed to recover in 0.1X MBS before fixation. Un-injected control embryos (A-C); embryos injected into the blastocoel with 23nl ROK inhibitor at stage 8 (D-F).
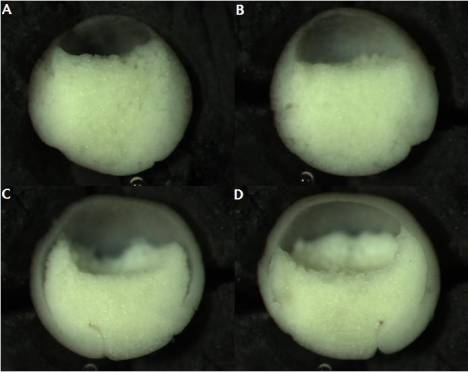
Figure 6: ROK-inhibited embryos allowed to recover in 0.1X MBS before fixation. These embryos were weakly inhibited compared to those in Figure 5. Injected embryos (A & B); un-injected control embryos (C & D). Notice the collapse and shrinkage of blastocoel in A & B.
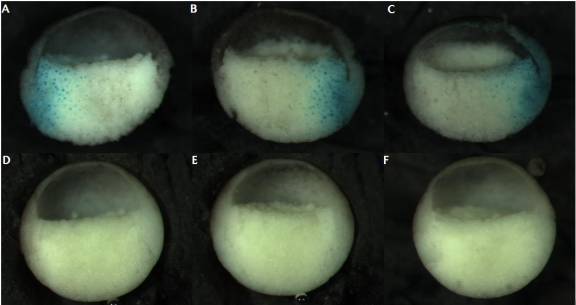
Figure 7: Comparison of the phenotypes produced by the inhibition of XRhoA (using DN-Rho mRNA in A-C), and ROK (using ROK inhibitor in D-F).
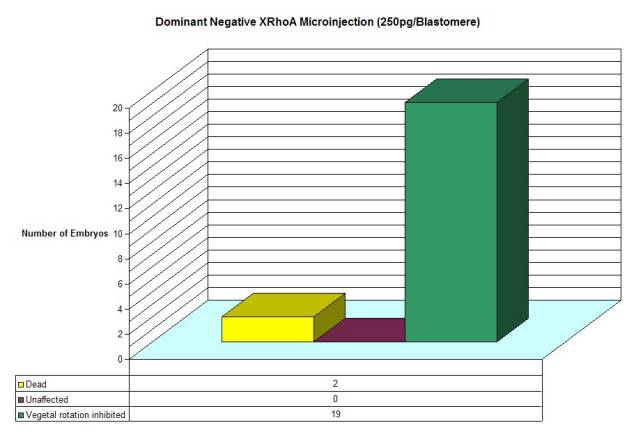
Figure 8: Graphic summary of XRhoA inhibition. The graph corresponds to Figure 2.
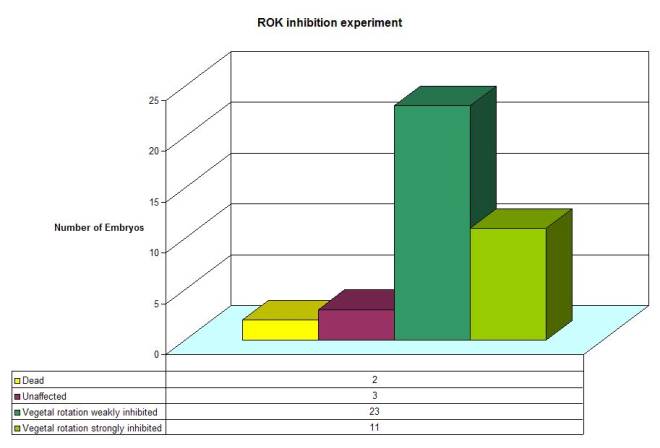
Figure 9: Graphic summary of ROK inhibition experiment. The Graph corresponds to Figures 5 & 6.