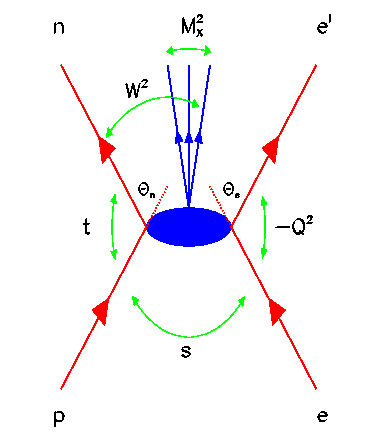
The figure is a Mandelstam Diagram. It depicts symbolically
an electron (e)
and a
proton (p)
colliding with one another. In
the resulting interaction the proton (p) is
deflected and converted
into a neutron (n)
while the electron is only deflected (e'). The
angle
through which they are scattered is represented by θ.
Simultaneously, new particles are created whose mass is MX.
The square of the mass of the whole process is
represented
by s.
The square of the momentum transfered from the proton
and neutron is represented by t; from
the electron by Q2.
Stanley Mandelstam first suggested the use of diagrams like
this
one
in 1958.