Canadian Protestant Church Growth
Some statistical information in graph form
This page presents several graphs prepared by Stuart Macdonald of Knox College. For more detailed research results, please go to his website. The images need to be left large so that the details can be seen, so viewers will simply need to scroll down the page to see the graphs. The following graphs are available:
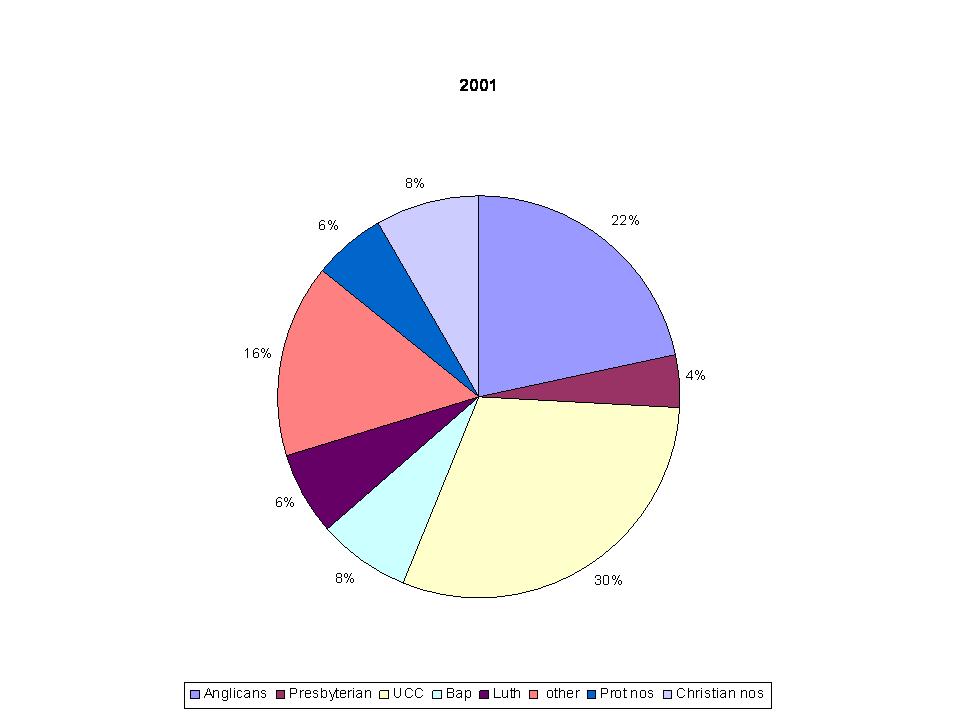
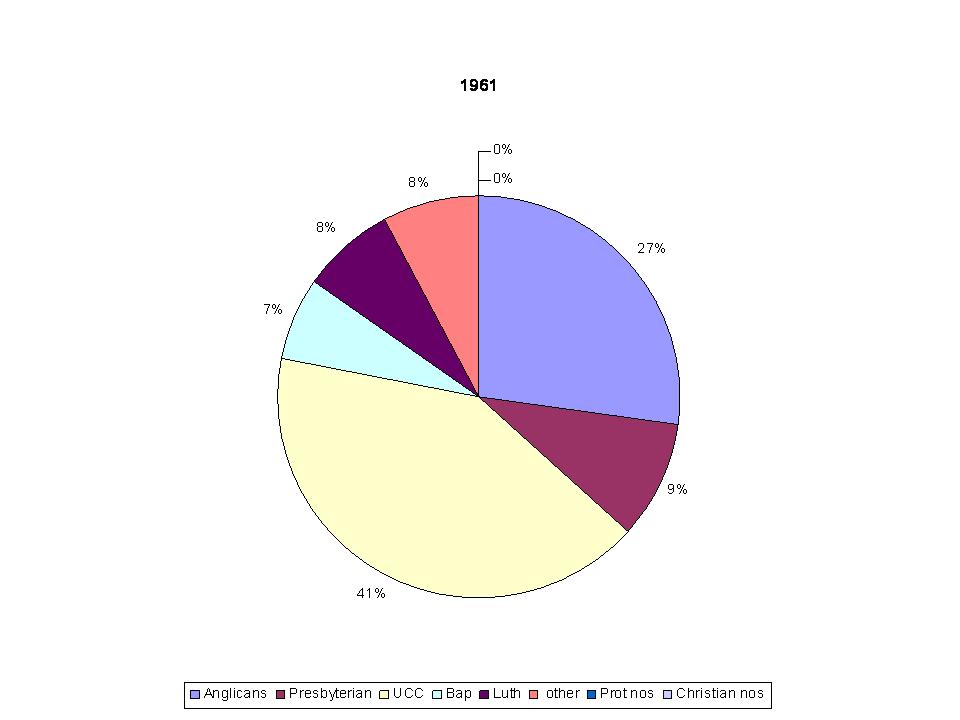
1. A pie chart showing, from the 1961 census, Canadian Protesants as a whole (100%) and the following pieces: the "big five" (Anglican, Baptist, Lutheran, Presbyterian, United Church), other specified denominations, those who answered "Protestant", and those who answered "Christian". (Note: in the legend at the bottom "Christian nos" should read "Christian nie" = "Christians not included elsewhere".)
2. The same, from the 2001 census. (Again, in the legend, "Christian nos" should read "Christian nie".)
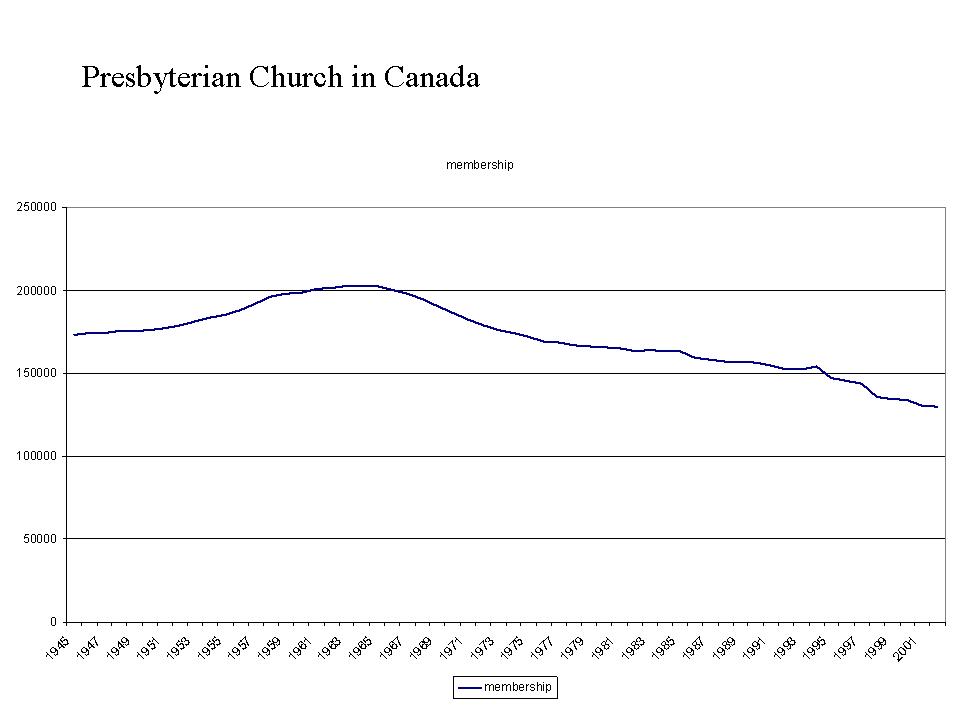
3. Presbyterian Church in Canada membership, 1945-2001.
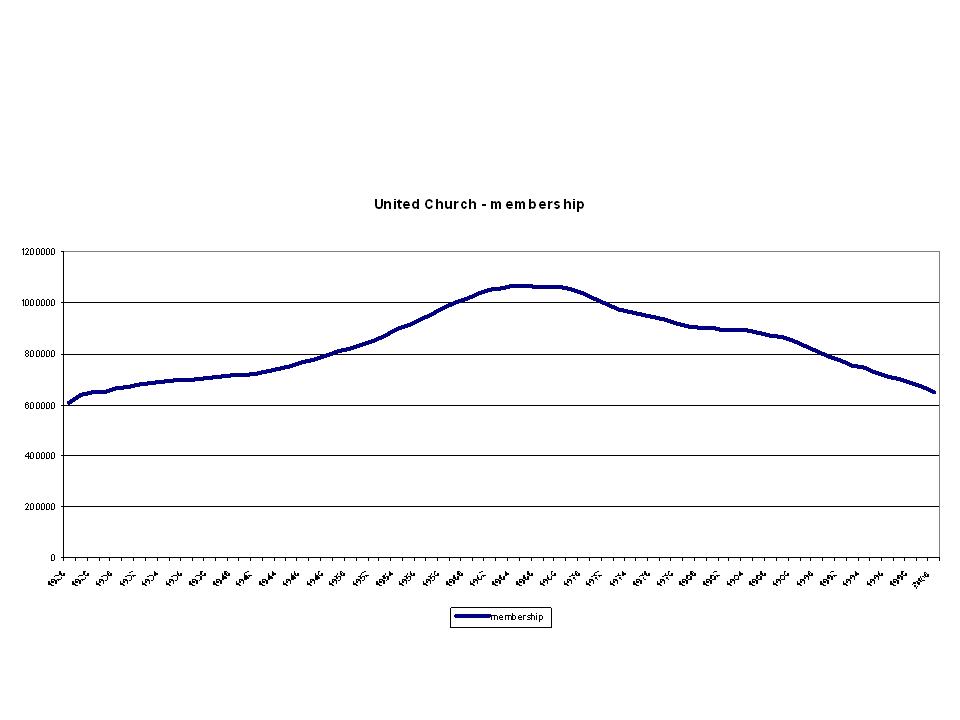
4. United Church of Canada membership, 1926-2000.
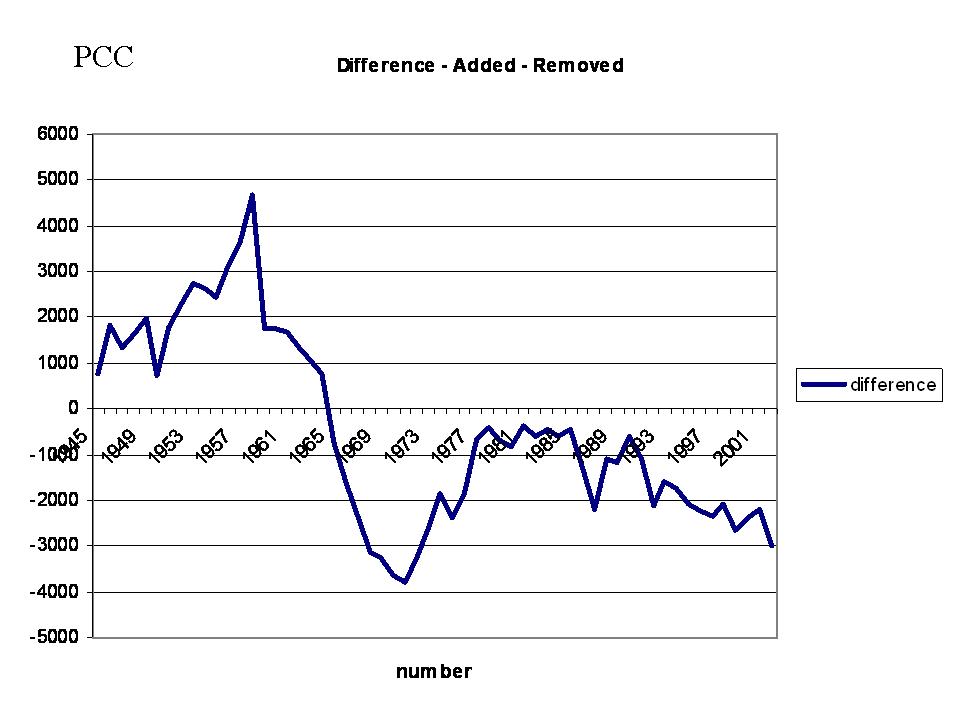
5. Presbyterian Church in Canada, net change in membership, 1945-2001 (the difference between those added and those removed).
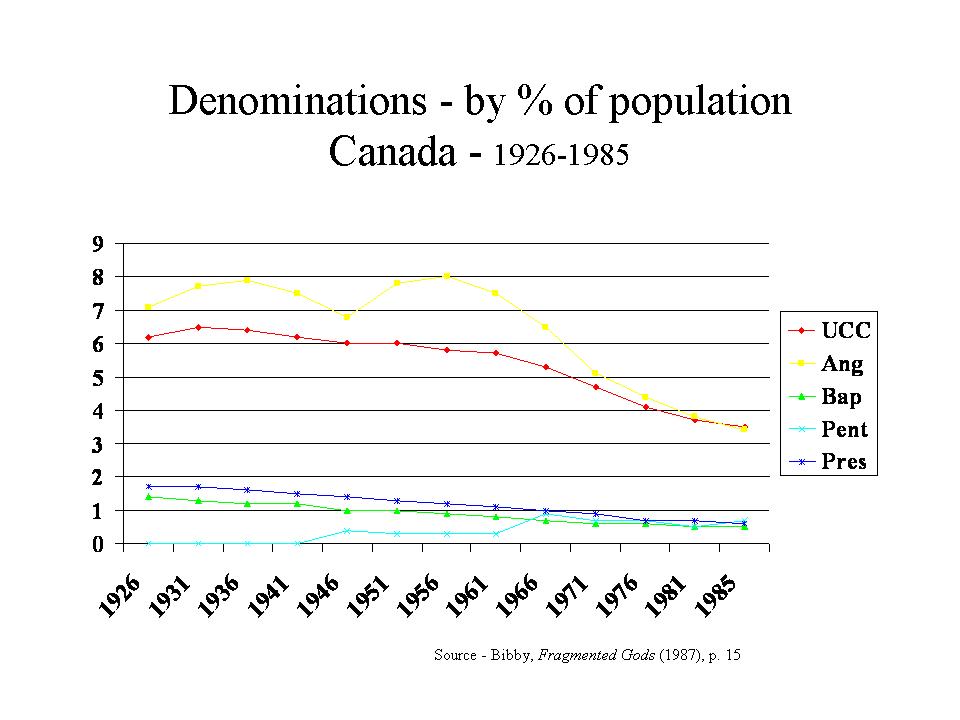
6. Five denominations (Anglican, Lutheran, Pentecostal, Presbyterian, United) as a percentage of total Canadian population, 1926-1985, using statistics from Reginald Bibby, Fragmented Gods.