The analyzer is designed to handle many simultaneous noise and background signals at once, and can concentrate on whichever one you specify, including its harmonics. To do that, you need to specify where on the spectrogram you are interested in. You can look on the spectrogram (drag the magnifying glass over a region to zoom in) and find the approximate region of the spectrogram where your waveform of interest is located (specifically, the approximate time and approximate frequency of its fundamental).
Quick start:
| Old Method | Visual inspection ("eyeballing") | ⇒ | Imprecise result | |||
| New Method | Visual inspection ("eyeballing") |
| Precise result |
Enclosing an event on the spectrogram with a box -- this causes the program to analyze only what is inside the box, and precisely locate the statistical center of activity. The program provides a statistical description of the sound event, so you can describe the sound using just a few concise numbers.
To create a box enclosure, enter command "4" in the command window. You specify one box to enclose the fundamental frequency only. For the center position of the box, enter your guess of the fundamental frequency, and your guess of the time (or equivalently, the exact time you would like to analyze). Thus, the position of the box is established. The next step is to set the width and height of the box (measured in time and frequency). Make sure the box surrounds spectral peak, with approximately a 20% margin around it.
Remember again that this initial box should only surround the fundamental of the event. If you specify several harmonics, then the program propagates your original box and creates additional boxes, in order enclose each harmonic separately. If the higher-harmonic boxes miss their respective harmonics, you will need to redo the box trial with a better estimate of the fundamental frequency, since that is what sets the locations of the other boxes.
Finally, the program performs some matrix calculations, and determines a very precise readout of the frequency and time of the event enclosed inside the boxes. Remember that enclosing only part of the event's peak produces incorrect results, since the program only considers what is going on inside the boxes.
Here is an example of how an event on the spectrogram can be enclosed. We decide we want to measure a tone that occurred around 4.95 seconds. We first zoomed in around the event (with the magnifying glass tool, clicking and dragging over the event to zoom in).
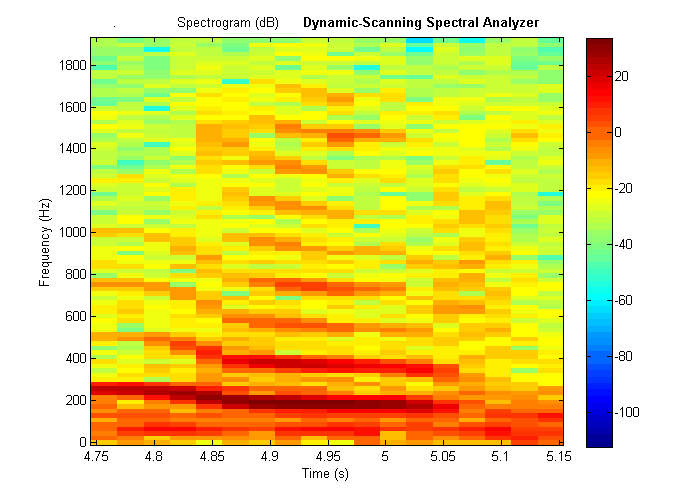
To enclose this event with a box, we should decide on a box shape that will capture as much useful information as possible, but reject irrelevant information. To enclose a relatively stable range of frequencies, our box will be centered at 4.95 seconds, with a duration of 0.1 seconds. The fundamental appears to be centered near 200 Hz (though the program will give a much more precise result). We try to enclose the 9 harmonics that are visible.
The boxes show up as follows.
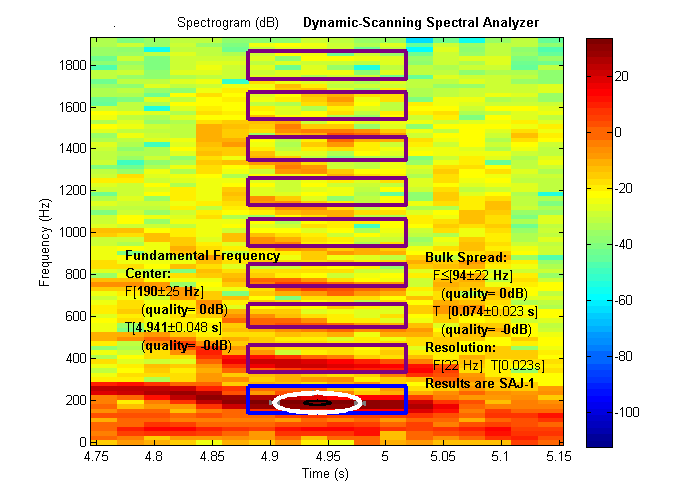
Problem: our estimate of 200 Hz is not quite right, and the top boxes are off their mark. To get the box centers to line up better, we notice that the 8th harmonic is somewhere near 1500 Hz, so an easy trick is to enter "1500 / 8" as below. We also slightly increase the frequency width to 120 to make sure the boxes completely surround each of the peaks.
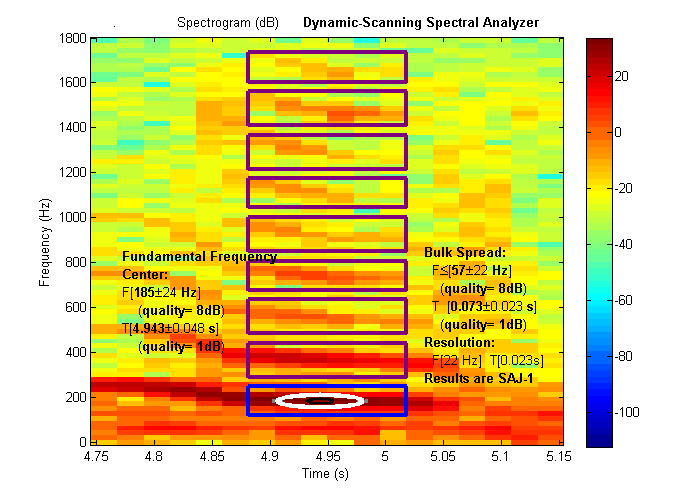
This result is much better. We created a much better enclosure, and increased the quality of the frequency measurements from 0dB to 8dB.
Each harmonic is neatly surrounded on the top and bottom by the boxes, with a small amount of margin space.
The displayed measurements can be put directly into your research results.
e.g.
| The fundamental frequency is 260 Hz +/- 10 Hz (with a measurement quality of 12dB, as per the SAJ-1 specification(1)) |
Include a footnote:
(1) SAJ-1 results are explained at:and/or include a reference to:
http://individual.utoronto.ca/janzen/spectral/saj
You can place the graphs in your paper:
[1] Ryan Janzen and Laura Bolt (2009). "Improved measurement algorithm for vocal communication research, with application to Lemur Catta", Proc. IBAC 2009, Bioacoustics Journal (to appear)
If the frequencies appearing on the spectrogram are too blurry (not enough frequency resolution), then you can press 8 to create a new spectrogram with better frequency resolution.
If you are analyzing a quick signal and are interested in exactly what time it occurred, but the spectogram is too blurry in time (not enough time resolution), then you can press 8 to create a new spectrogram with better time resolution.
Spiral: Number of loops around = how intricately you would like the algorithm to explore around your region. "2" is a good value to try.
Harmonics: Number to examine = how many boxes should be created to enclose harmonics. Do not specify so many boxes that they would spill over the top of the spectrogram.
Viewing pause time between each trial = number of seconds to slow down the analysis
Finally, the analysis will take a short time to execute. When complete, the markers will sit dormant at the last trial, waiting for you to cause them to snap back to the best trial.
Once multiple trials have been run through, the program waits for you to request data from a specific one of the trials.
For example, from the main menu you can enter "1" if you are trying to determine the fundamental frequency. Enter "2" if you were trying to determine the time of a percussive event (spread vertically across many frequencies). Enter "3" if you want to know the frequency and time of a short tone that was completely enclosed by your box enclosures.
If you wish to jump to the results of any one of the trials (as listed along the x-axis of the multiple-trials graphs), the command is "-[trialNumber]". That is, in the command window, type "-" followed by the trial number.
SAJ is an easy way to express your results -- be scientifically precise, without needing to write a whole paragraph on signal-processing -- just write "as per the SAJ-1 specification."
Your results from the program are automatically expressed in SAJ-1. This ensures uniformity between different researchers in different fields. To see the exact details of what is contained inside your SAJ-1 data, see here.