|
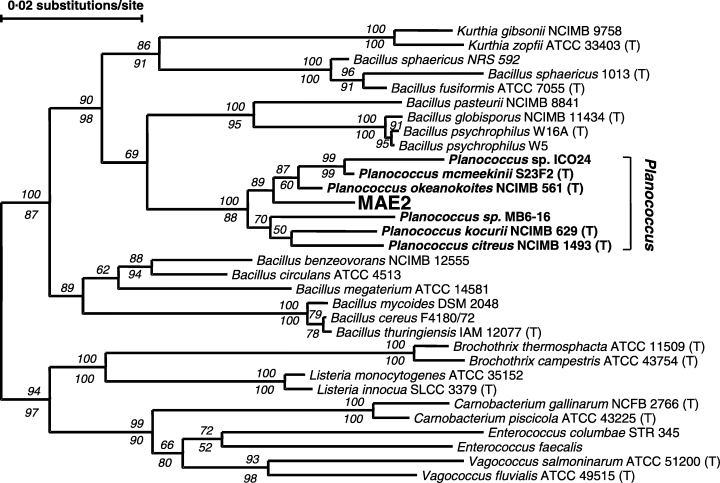
Phylogenetic distance tree of selected Gram-positive bacteria. Bootstrap values for distance analysis are given above the nodes and bootstrap values for parsimony analysis are given below the nodes. Bootstrap values below 50% have been omitted.
from Engelhardt et al, JAM 90:237
|

