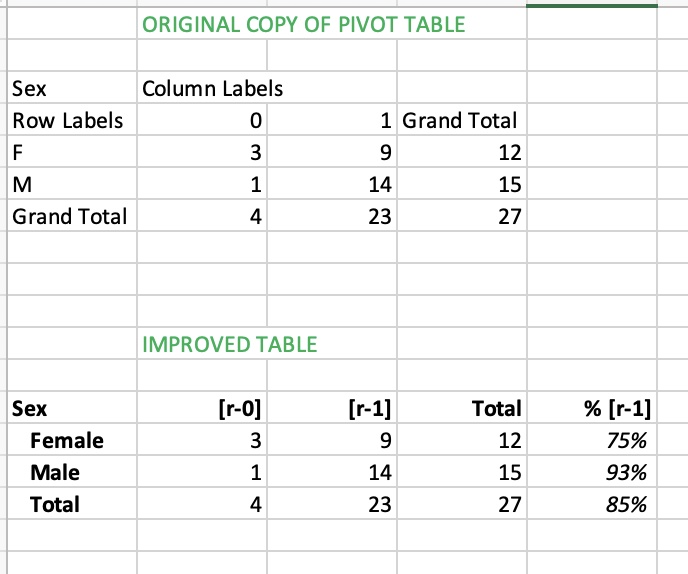
SCREENSHOT of DISTRIBUTIONAL RESULTS TABLE with 27 tokens of (r) coded
The top table is a copy (made with Paste Special > Values) of the Pivot Table; the bottom table is an improved table that will be more easily readable by an outsider.
 Updated January 4, 2023