|
Example 1|Quiz |Example 2 | Example 3 |Useful Web Resources| Solutions
.
Theorem 2.8-1:
The covariance of a pair of random variables X and Y is
The correlation is
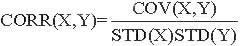
- Correlation is a measure of the strength of the linear relationship between two random variables
- -1 £ CORR(X,Y) £ 1
- If the correlation is positive, then Y tends to increase as X increases. Eg, if X and Y represent income and education, the correlation would be positive. We would expect the level of income to increase when the level of education increases.
- If correlation is negative, the random variables tend to move in the opposite directions. Eg if X and Y represent education and years in jail. We would expect the number of years in jail to decrease as the level of education increases.
- If the correlation is -1 or 1, there is a perfect linear relationship between X and Y
- If correlation is 1, then Y=a+bX, where b>0 (Remember, b represents the slope of the line)
- If correlatoin is -1, then Y=a+bX, where b<0
- If the random variables are independent, the correlation and covariance are zero.
COV(X,Y) = E[(X-E(X))(Y-E(Y))]
= E(XY)-E(X)E(Y)
If X and Y are independent, E(XY)=E(X)E(Y). Thus COV(X,Y) =0 and CORR(X,Y)=0 when X and Y are independent.
Example 1:
Let X and Y have joint probability mass function.
| x |
| y |
p(x,y) |
0 |
1 |
2 |
3 |
4 |
0 |
0.06 |
0.02 |
0 |
0.03 |
0.04 |
1 |
0.09 |
0.06 |
0 |
0.01 |
0.04 |
2 |
0.09 |
0.04 |
0 |
0.02 |
0.06 |
3 |
0.03 |
0.08 |
0.2 |
0.01 |
0.02 |
4 |
0.03 |
0 |
0 |
0.02 |
0.02 |
5 |
0 |
0 |
0 |
0.01 |
0.02 |
Part A : Fill in the probability mass functions of X and Y below. Please round your answers to one decimal place.
Solution

Part B: Using the probability mass functions from above, please answer the following questions.
Solution
Free JavaScripts provided by The JavaScript Source
Theorem 2.8-1:
Let W= aX+bY. Then

Example 2:
Let W=14X-3Y. Let X and Y be the random variables in Example 1.
E(W)= 14E(X)-3E(Y)= 14(1.7) -3(2.07)=17.59
VAR(W) = 14^2VAR(X)+ (-3)^2VAR(Y)
= 196(2.21)+ 9(1.69)
= 448.37
STD(W)= sqrt( 448.37)= 21.17
Solution
Definition 2.8-2:
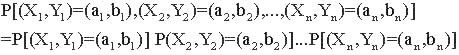
Random pairs (X1,Y1), (X2,Y2), ... , (Xn,Yn) of discrete random variables are mutually independent if
Definition 2.8-3:
Random pairs (X1,Y1), (X2,Y2), ... , (Xn,Yn) are a bivariate random sample if they are independent and identically distributed.
Definition 2.8-4:
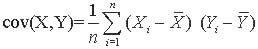
Let (X1,Y1), (X2,Y2), ... , (Xn,Yn) be a bivariate random sample. Let Xbar, Ybar,Sx and SY be the sample means and standard deviations of the Xi's and Yi's. The sample covariance is defined as
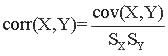
The sample correlation is defined as
Example 3:
Let X represent the number of hotdogs and Y represent the number of beers consumed at a baseball game. The following is the observed random sample of (X,Y) for 14 individuals:
(1,2), (1,3) ,(2,3), (0,2), (0,3), (1,3), (2,3), (0,1), (1,1), (2,1), (0,2), (3,2), (3,0), (2,1).
Xbar = 1.29 Sx = 1.07
Ybar = 1.93 SY= 1
COV(X,Y) = (1/14) [ (1-1.29)(2-1.93) + (1-1.29)(3-1.93) + ... + (2-1.29)(1-1.93)]
 Check your answers by using th following online calculator. Help! Check your answers by using th following online calculator. Help!
Useful Web Resources
Covariance and Correlation
Theory: Covariance and Correlation
Variances, Covariance & Correlation
Solutions
Solution to Example 1 (Probability mass functions)
| x |
0 |
1 |
2 |
3 |
4 |
| p(x) |
0.30 |
0.20 |
0.20 |
0.10 |
0.20 |
| y |
0 |
1 |
2 |
3 |
4 |
5 |
| p(y) |
0.15 |
0.20 |
0.21 |
0.34 |
0.07 |
0.03 |
Solution to Example 1 part b
1:
E(X)= 0(0.3)+1(0.2)+2(0.2)+3(0.1)+4(0.2)= 0.2 + 0.4 + 0.3 + 0.8 = 1.7
E(X^2) = 0(0.3)+1(0.2)+4(0.2)+9(0.1)+16(0.2)=0.2 + 0.8 + 0.9 + 3.2 =5.1
VAR(X)= E(X^2) - [E(X)]^2= 5.1- (1.7)^2= 2.21
2:
STD(X)= sqrt(2.21)=1.4866= 1.49
3:
E(Y)= 0(0.15)+1(0.2)+2(0.21)+3(0.34)+4(0.07) +5(0.03)= 0.2 + 0.42 + 1.02 + 0.28 +0.15= 2.07
E(Y^2) = 0(0.15)+1(0.2)+4(0.21)+9(0.34)+16(0.07) +25(0.03)= 0.2+ 0.84 + 3.06 + 1.12 + 0.75 =5.97
VAR(Y)= E(Y^2) - [E(X)]^2= 5.97- (2.07)^2= 1.6851=1.69
4:
STD(Y)= sqrt(1.6851)== 1.298 =1.30
5:
E(XY)
= (1)(1)(0.06) + (2)(1)(0.04) + (3)(1)(0.08) + (3)(2)(0.2) + (1)(3)(0.01) + (2)(3)(0.02) + (3)(3)(0.01) + (4)(3)(0.02) + (5)(3)(0.01) + (1)(4)(0.04) + (2)(4)(0.06) + (3)(4)(0.02) + (4)(4)(0.02) + (5)(4)(0.02)
= 0.06 + 0.08 + 0.24 + 1.2 + 0.03 + 0.12 + 0.09 + 0.24 + 0.15 + 0.16 + 0.48 + 0.24 + 0.32 + 0.4 =3.81
The table below outlines in blue which non zero terms were used to compute E(XY):
| x |
| y |
p(x,y) |
0 |
1 |
2 |
3 |
4 |
0 |
0.06 |
0.02 |
0 |
0.03 |
0.04 |
1 |
0.09 |
0.06 |
0 |
0.01 |
0.04 |
2 |
0.09 |
0.04 |
0 |
0.02 |
0.06 |
3 |
0.03 |
0.08 |
0.2 |
0.01 |
0.02 |
4 |
0.03 |
0 |
0 |
0.02 |
0.02 |
5 |
0 |
0 |
0 |
0.01 |
0.02 |
6:
E(XY) does not equal E(X)E(Y). Therefore, X and Y are not independent.
7:
COV(X,Y)= E(XY)-E(X)E(Y)= 3.81-( 1.7)(2.07)=0.291=0.29
8:
CORR(X,Y)= COV(X,Y)/[STD(X)STD(Y)] =0.29/( 1.7)(2.07)=0.0824=0.08
Solution to Example 2
A:
VAR(W)=VAR(X)+(-4)^2VAR(Y)= 2.21+16(1.69)=5.9449=5.94
B:
VAR(W)= 25VAR(Y)+4VAR(X)=25(1.69) +4(2.21)= 51.09
STD(W)= sqrt(51.09) =7.147= 7.15
Solution to Example 3
The results from the statistical calculator are :
X:
To find Xbar, sum up all the X values from each pair of observations.
Xbar=1.2857143=1.29
Var(X)= 1.1428571 =1.14
Sx=sqrt(1.14)= 1.0677=1.07
Y:
To find Ybar, sum up all the Y values from each pair of observations.
Ybar=1.9285714=1.93
Var(Y)=0.9945055=0.99
SY = sqrt(0.9945055)= 0.99724= 1
COV(X,Y) = (1/14) [ (1-1.29)(2-1.93) + (1-1.29)(3-1.93) + ... + (2-1.29)(1-1.93)] = -0.29
CORR(X,Y)= COV(X,Y)/[STD(X)STD(Y)] = -0.29 / (1.07)(1)= -0.27
Help using Online calculator.
When the web page opens, scroll down to the bottom of the page. There you will find a table, where the rows are labeled "Variable X" and "Variable "Y". In the row labeled "Variable X", enter the X values from the pairs of observations. For example, our first 3 observations are (1,2), (1,3) ,(2,3). Therefore, you would enter, 1, 1, 2 into the slots in the row labeled Variable X. Similarly, you would enter 2, 3, 3 into the slots in the row labeled "Variable Y". Press Calculate at the bottom of the table, and the statistics will be displayed.
.
.
|