7.6 Comparisons of two approaches
Some Assumptions
The system works better :-
1)if size of all the images is same.
2)The distance of a person from the camera and the magnification factor is same for test and training images.
3) Variation of the light intensity on an image of a same person in two different pictures can also be a problem. So let's assume that it's almost same or have little variation.
Comparison Tests
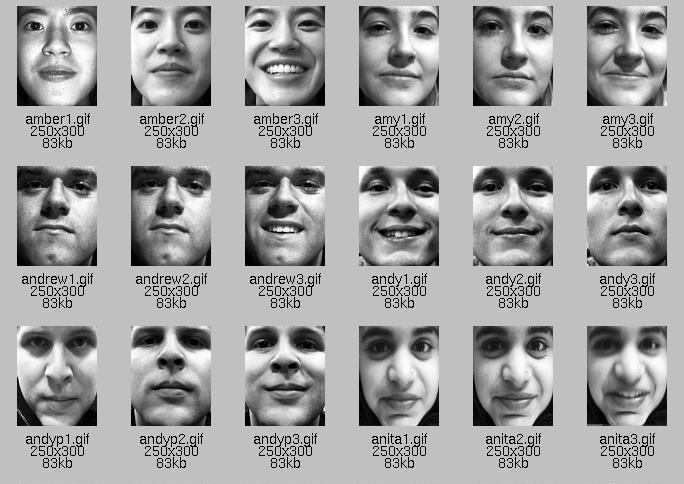
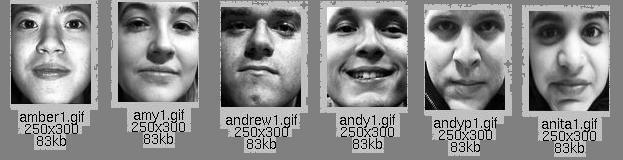
All the images [training & test] can be accessed from the main menu.
Number of Images in Training Set = 6
Number of Test Images = 18
(A)
EigenFace Approach
What we basically do in this approach is grab pixel of all the images and store them in a suitable data structure such as matrix. Then we find the covariance matrix . But the question arises why do we want to do that ? Let's think that we have stored all the pixels of an image in a single column of a matrix . So that rows of the first column represents pixels of first image, rows of the second columns represents pixels of second image and so on. As we know that for finding the covariance between different dimensions , first we have to find its deviation from the mean of data. So first we calculate Difference image matrix .Subtract pixel-Nth of img1 from pixel-Nth of the average image. and store it in the corresponding position in the matrix. Now we can find the covariance matrix by multiplying the matrix with its transpose. That matrix tells us how a value of a particular pixel can vary from its original value ,if the value of corresponding pixel in other images is varied. Just like the covariance between the marks a student receives and the number of hours he/she studies. Using principal eigen vectors we can establish different amount of variations from the face image. When we project a new face on to the derived eigen faces , all that we have to do is to find the nearest face image to that projected face using eigen vectors. if the distance from the nearest face image is with in some threshold value then we return that face image as the identified face otherwise we can add that projected face to the training image set and can repeat the PCA procedure on that.
Using EigenFace Approach I found the following results :-
Test Image Matched with training Image
Amber1.gif Amber1.gif
Amber2.gif Andyp.gif
Amber3.gif Andyp.gif
Amy1.gif Amy1.gif
Amy2.gif Amy1.gif
Amy3.gif Amy1.gif
Andrew1.gif Andrew1.gif
Andrew2.gif Andrew1.gif
Andrew3.gif Andrew1.gif
Andy1.gif Andy1.gif
Andy2.gif Andy1.gif
Andy3.gif Andyp1.gif
Andyp1.gif Andyp1.gif
Andyp2.gif Andyp1.gif
Andyp3.gif Andyp1.gif
Anita1.gif Anita1.gif
Anita2.gif Amy1.gif
Anita3.gif Amy1.gif
Success Rate = ( Correctly matched / Total number of test images) * 100 = (13/18) *100 = 72.2 %
(B)
An Another Approach
Store all the training images in a matrix where each column of the matrix represents a single image. So the number of columns of a matrix will be same as the number of training images. Number of rows corresponds to the number of pixels in an image. Since each image has same width and height therefore number of rows will be same for each image. Then we are finding the distance between a test image and the training images . The training image which has least distance from the test image and is with in the threshold value is returned as the identified image. There are three possible cases provided that all the assumptions described above are true .
a) Input test image is exactly same as one of the training image.
If this is the case then difference of test image and that training image will be zero and hence is the minimum possible.
b) Input test image is not exactly same as one of the training image because there is variation in the facial expression or pattern.
We know that humans have different facial expressions at different occasions . If we are placing a face of human under test in a 2-D graph we can find the coordinates of any part of the face. it happens rarely that expression of all parts of the face changes drastically . For example if a person is smiling then there is more variation in cheek part of the face as compared to the eyes. Hence most of the face parts doesn't change at the same time. So when we are subtracting the test image with different face expression from the training image of the same person , for the parts which are less changed , we will get very less values. If we subtract that test image from the training image of some other face , it is very less likely that image will have all the same facial features as that of test image, so it will give us a large value . Hence most of the time we will be able to identify the right person even if the two images have different face expressions. In my test it worked fine with 8 images out of 10.
c) Input test image is not in the training image set.
Most of the times we will get the least value which is above predefined threshold value . In very few cases face of two different persons might be matched because their most of the prominent face parts fits at the same location on a 2-D graph. And if this happens then we will get the least distance, less than threshold value, for that training image . In my tests it happened with 2 images out of 10 .
Using My simple approach I found the following results :-
Test Image Matched with training Image
Amber1.gif Amber1.gif
Amber2.gif Andy1.gif
Amber3.gif Andy1.gif
Amy1.gif Amy1.gif
Amy2.gif Amy1.gif
Amy3.gif Amy1.gif
Andrew1.gif Andrew1.gif
Andrew2.gif Andrew1.gif
Andrew3.gif Andrew1.gif
Andy1.gif Andy1.gif
Andy2.gif Andy1.gif
Andy3.gif Andy1.gif
Andyp1.gif Andyp1.gif
Andyp2.gif Andrew1.gif
Andyp3.gif Andy1.gif
Anita1.gif Anita1.gif
Anita2.gif Anita1.gif
Anita3.gif Anita1.gif
Success Rate = ( Correctly matched / Total number of test images ) * 100 = (14/18) *100 = 77.7 %