
|
Wenhui Wang, PhD |


|
Research |
|
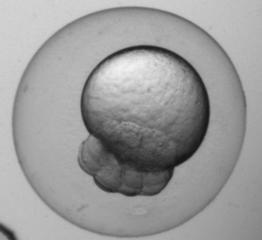
Zebrafish-a wonderful model for studying vertebrate development and genetics
For more information about zebrafish, visit http://zfin.org.
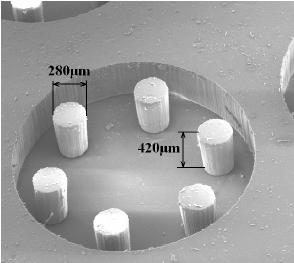
Micro-fabricated PDMS zebrafish-embryo holding device, three-layer SU-8 mold
Embryo biomechanics study
video clip The device has the capability of visually resolving forces down to 0.52nN with a 40× objective.
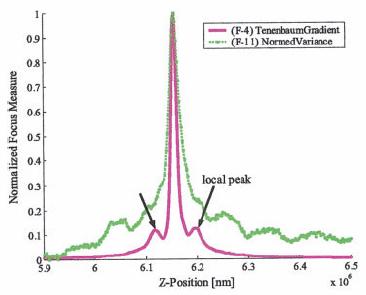
Auto-focusing algorithm
video clip showing two-step auto-focusing procedure. The forward step travels from out-of-focus A ->in-focus-> out-of-focus B to form the focus measure curve. The backward step travels from the out-of-focus B ->in-focus.
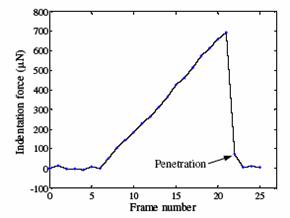
Contact detection in microrobotic manipulation via computer vision microscopy
In image plane, the tip has a global extreme position (peak of V-shaped curve) when the initial contact occurs, according to the established imaging analysis.
To detect contact, firstly locate the tip (by specifying a region of interest) in the image; secondly, lowering down the micropipette till the deformation in the image can be sensed. Detection resolution reaches sub-micron, which was calibrated by sensing the contact force change from 0 to 0.1mN using an analytical balance (XP205, Mettler Toledo) with a 0.01mg (0.1µN) resolution.
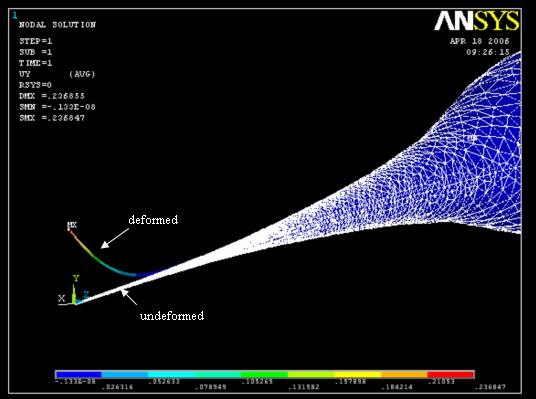
Ansys simulation on the relationship of the contact force and tip deflection. Deflection 2000 times the true value for ease of visualization. Applied force, 0.1µN; induced max. deflection, 0.24µm. Click for video clips: magnification 9´ contact on glass surface magnification 9´ contact on PDMS magnification 2.5´ contact on PDMS
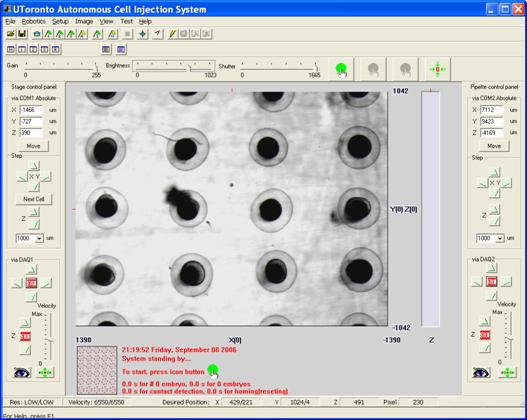
High-throughput automatic zebrafish embryo injection system Featuring: ・ Fast embryo immobilization: 3-5s; ・ High-throughput: 15 embryos/minute (chorion unremoved); ・ Success rate: 99% (n=350 embryos); ・ Survival rate: 98% (n=350 embryos); ・ Phenotypic rate: 98.5% (n=210 embryos).
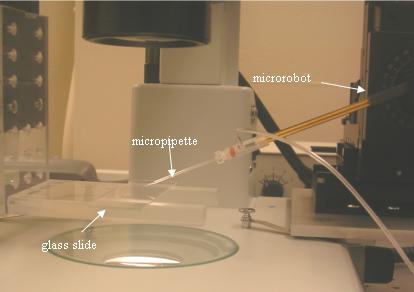
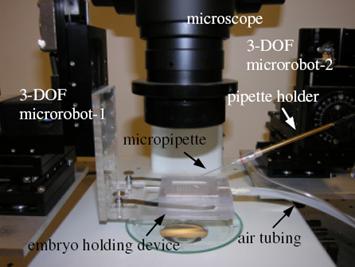
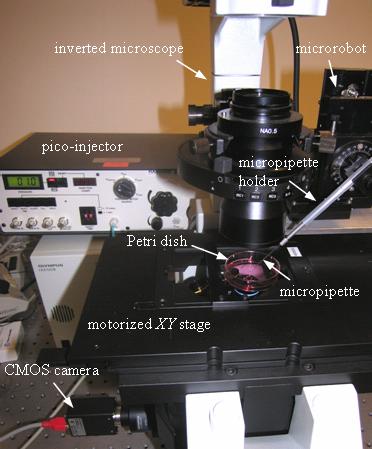
Experimental setup
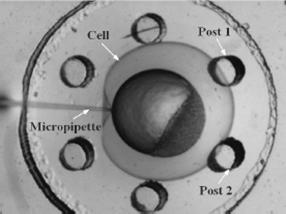
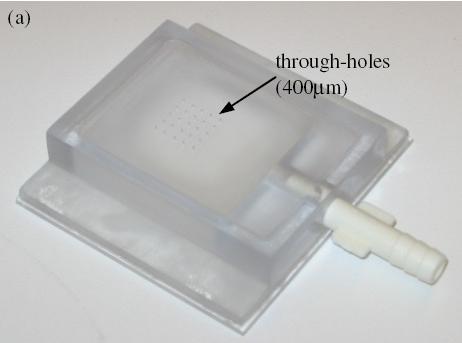
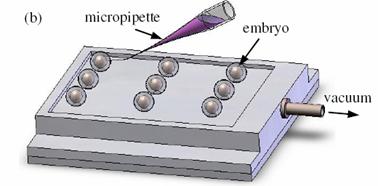
Vacuum-based cell holding device
(a) Device picture. (b) Device schematic with embryos immobilized for injection
Left: Upper structure Right: Assembly with embryos and micropipette A batch of zebrafish embryos are immobilized on the embryo holding device, one embryo sitting on one through hole. After the contact between the tip and a glass slide is established to determine the relative height of the tip and the embryo, the system starts injecting from the right-top embryo in the image.
Control interface with regularly-patterned embryos displayed in the view
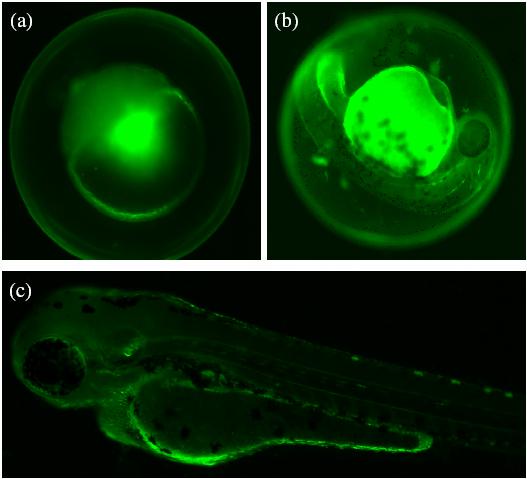
Embryos image taken under a magnification of 0.7´ Video: 25 embryos are continuously injected sequentially. Embryos injected with fluorescent dyes under fluorescent microscope: Development of wild-type zebrafish embryos injected with fluorescent dyes. (a) Right after injection. (b) 24hr after injection. (c) 48hr after injection.
24hr after injection with no-tail morpholinos, no-tail phenotype expressed.
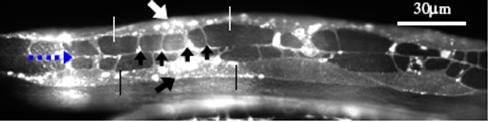
C. elegans phenotype characterization by microrobotic tracking and ON-LINE feature extraction Featuring: ・ 30Hz tracking; ・ On-line feature extraction; ・ No need to save images for off-line analysis.
Muscle arms of C. elegans on dorsal body wall muscles (BWM). Top arrow pointing at a Cpppaaa BWM (in the pair of white vertical lines). Bottom arrow pointing at a Cappaaa BWM (in the pair of black vertical lines). Middle arrows pointing at 4 muscle arms of Cpppaaa BWM. The leftmost dashed arrow pointing at a white line beneath which is the nerve. Muscle arms: daf-2 (RP398)>wt (RP247)>db (RP576)>tr64 (RP472) Video clips: daf-2 (e1370) with most muscle arms wild type with normal muscle arms double between daf-2 (e1370) and tr64 with less muscle arms Description of the video content: 1) The original-sized (640*480) image is superposed for comparison with: the worm's boundary (outlined in cyan), the skeleton (in white), the centroid of the worm (white); These features were extracted from the original-sized image. and the skeleton points (in red) extracted from the reduced-sized image with the points affined back to the original-sized image, the centroid (in red) of the worm extracted from the reduced-sized image with the points affined back to the original-sized image. These features were extracted from the reduced-sized image. 2) The small image at the right-bottom corner is the 1/16 reduced-sized image, superposed with the extracted skeleton (in cyan). 3) The bottom part shows the two tracking parameters of the worm: amplitude and instant velocity. Results: based on 128 worms, 32 samples / strain
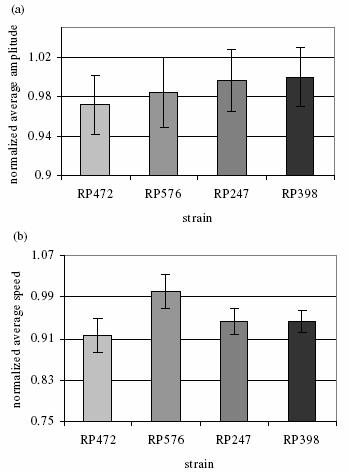
Worm strains shown on x-axis have an increasing muscle arm number. (a) Normalized average amplitude. (b) Normalized average speed.
Adherent cell injection Challenges: ・ Cell small, 40-60mm long, 10-20 mm wide, ~5mm thick; ・ Injection capillary tip extreme tiny: <1 mm; ・ Location of the cells and tip is very difficult; ・ Subject to low depth of focus.
Featuring: ・ High-throughput: 25 cells/minute; ・ Survival rate: 95.7% (n=1012 cells); ・ Success rate: 82.4% (n=1012 cells); ・ Flexible selection of deposition destinations.
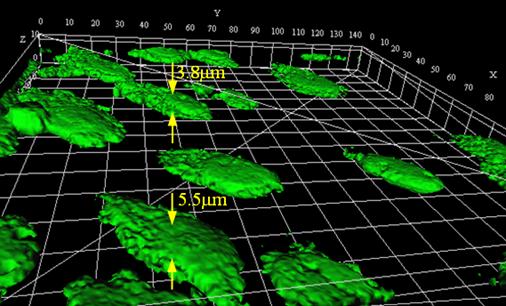
Endothelial cells (with heights of 3.8-5.5mm) are selected in this study. Endothelial cells line the entire circulatory system from the heart to the smallest capillary, playing important roles in the vascular system.
3-D profile of endothelial cells. Reconstructed from a stack of confocal fluorescence images.
The injection system starts with contact detection to align the vertical heights of the tip with respect to the Petri dish. Operator selects deposition destinations by clicking mouse on the graphic user interface where a field of view of cells are displayed. All the destinations are involved to determine a shortest injection path by traveling salesman algorithm. The microrobot then controls the micropipette to inject cells sequentially along the path.
Click for a video clip for high-throughput adherent cell injection. NEW!!
Injection results:
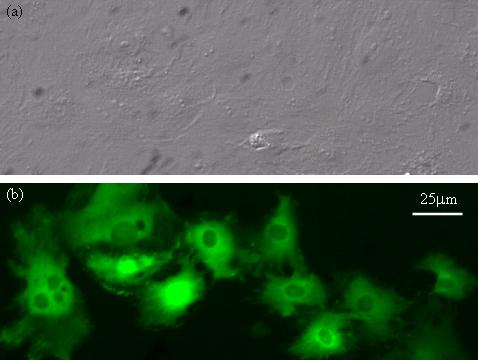
Cells injected with fluorescent dyes. (a) Bright-field image showing normal cell morphology is maintained after injection. (b) Fluorescence microscopy image.
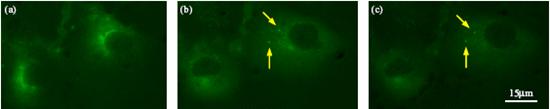
Cells injected with quantum dots (QDs). (a) Right after injection. (b) 1hr after injection. (c) 2hr after injection. The aggregated QDs are labeled by arrows.
|


Recent research in a nutshell, updated on Nov. 10,2007 |
|
chorion |
|
yolk |
|
cells |
|
500mm |