Visualizing
Variation
Alan Galey
Faculty of Information
University of Toronto
individual.utoronto.ca/
alangaley
Synoptic marginalia
(in progress)
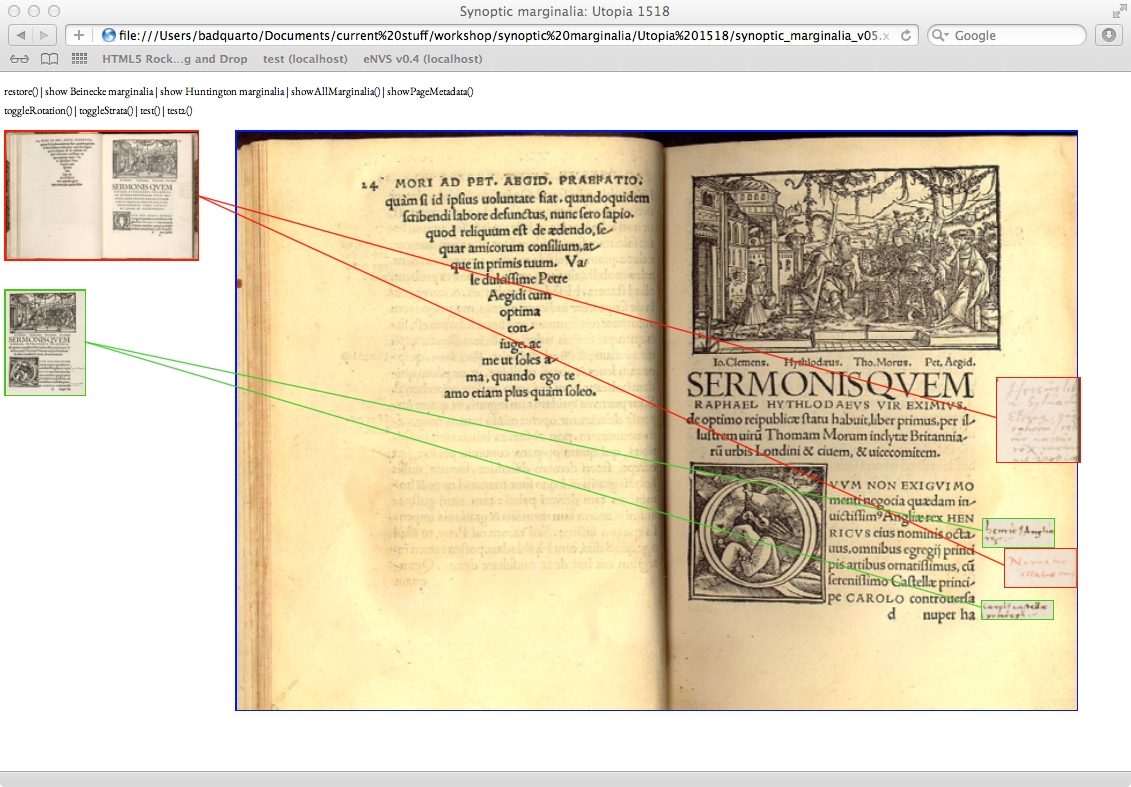 Readers' marginalia are among the few material traces of the act of reading that we can recover, and their study has yielded insights into the history of books and the reception of texts. Although we often think of printed books as identical mass-produced objects, reader marginalia makes each annotated copy a unique artifact, meaning that researchers must often travel to different libraries to examine different copies of the same book. Yet as much as marginalia re-asserts the uniqueness of specific copies, it also connects books in networks of reception. This particular prototype was inspired by Owen Gingerich's study of annotation patterns in copies of Copernicus's De revolutionibus, in which he realized that readers of this controversial astronomical book were having a kind of distributed conversation in the margins of their copies. In other cases, readers have even responded to each other in the margins of the same copy. Both kinds of evidence, when gathered carefully and represented together (i.e. synoptically), can enable researchers to piece together the conversations that readers were having with the text and with each other. This visualization prototype provides a means for representing marginalia in different copies of the same book, even when those readers and their books are distributed widely over space and time.
At present the visualization has two synoptic modes, one that arranges the marginalia together spatially (pictured here in its current rough form), and another that arranges the marginalia temporally, like geological strata (not pictured). The spatial and temporal dimensions of marginalia are best viewed in proximity, and the goal of this prototype is to enable viewers to move between those two dimensions easily. This is the second image-based visualization I am working on, and it uses many of the same techniques as Paratext Maps, above.