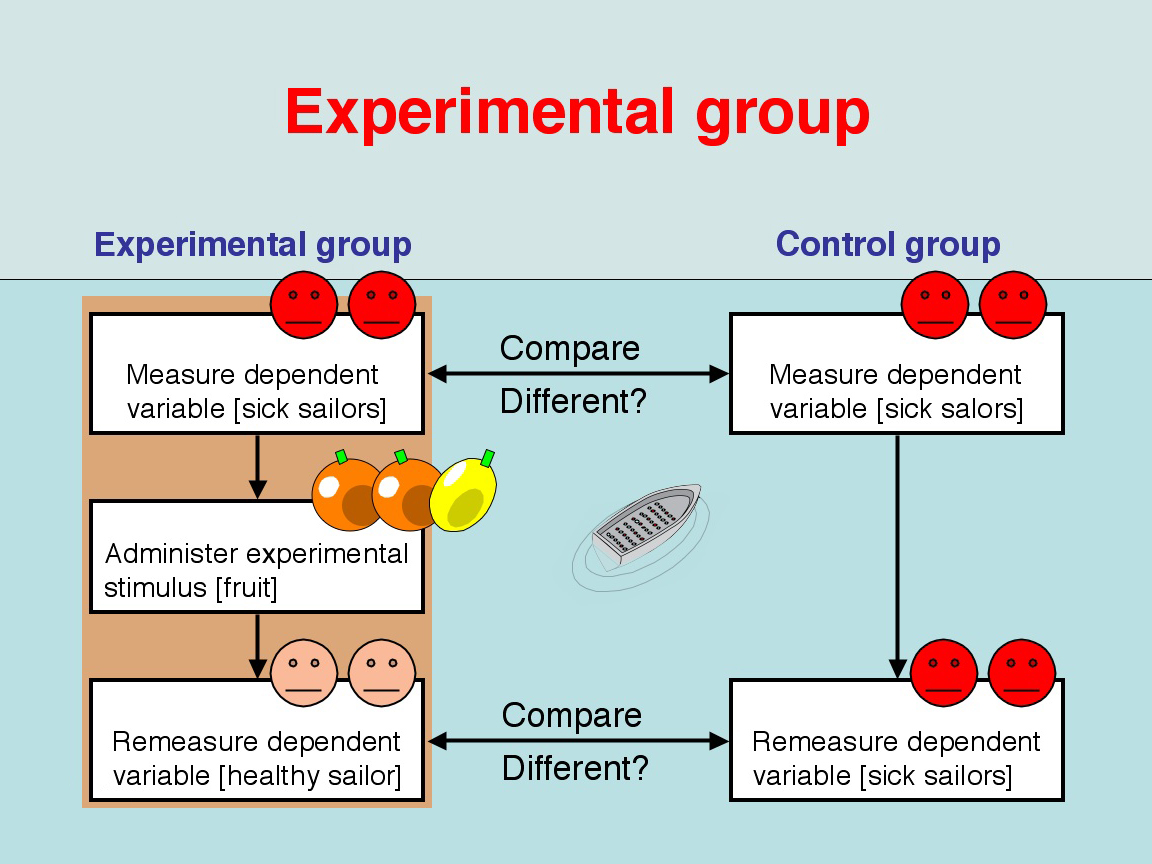
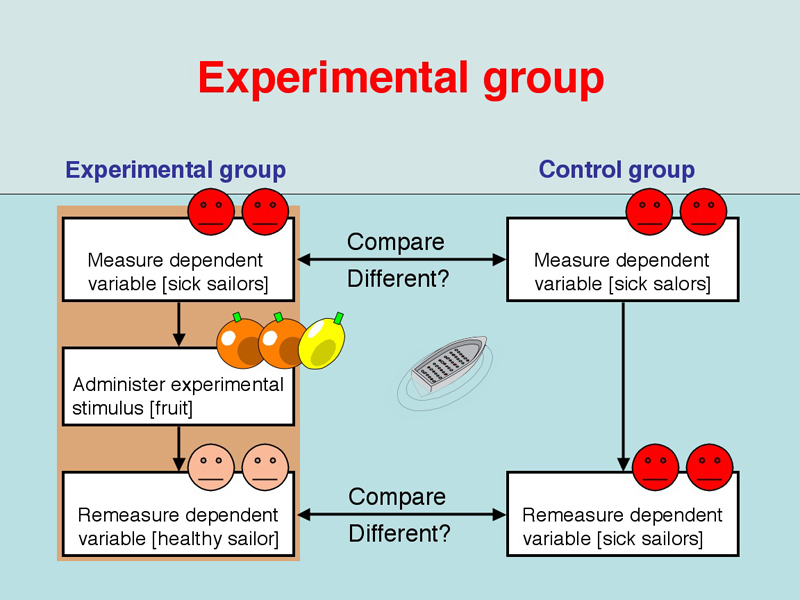
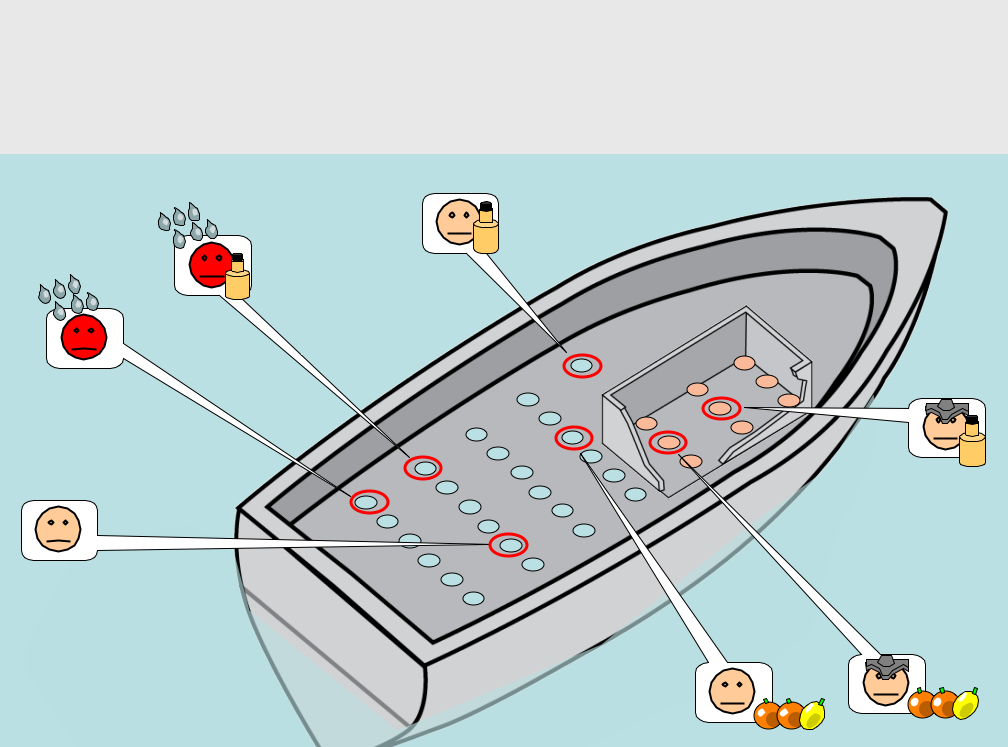
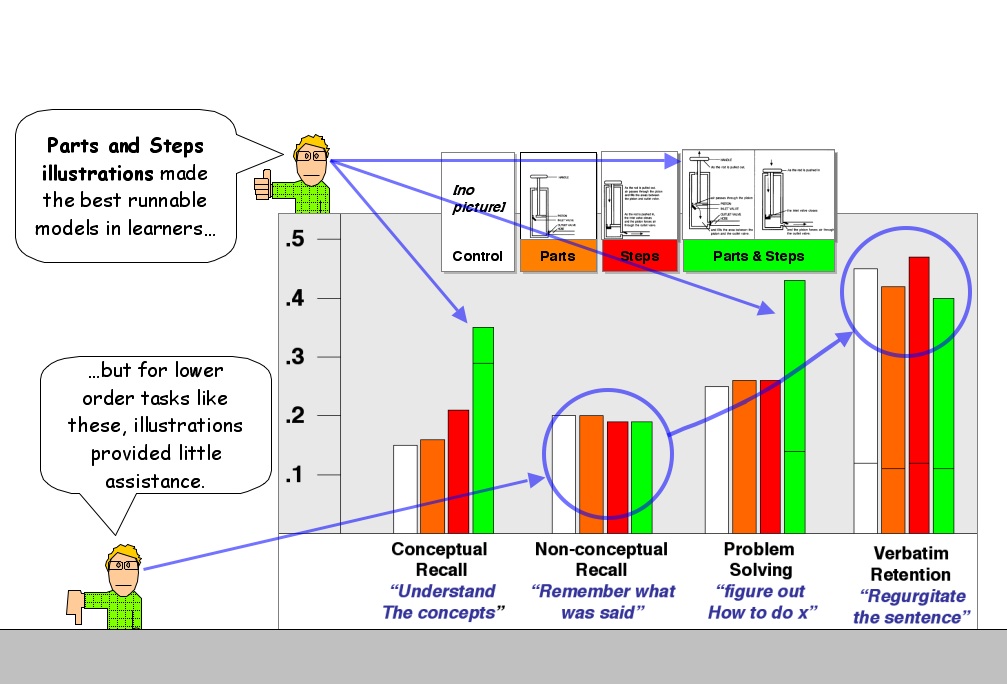
Peter Coppin | Visual explanations / Social science PowerPoint "sketches"


These diagrammatic "sketches" explain basic social science concepts. These illustrations were created in PowerPoint in order to enable non-artist colleagues to modify and augment the illustrations.


Experimental group
Explaining the classic experimental method
This picture is an excerpt from a sequential picture presentation explaining the classic experimental method, using the first 1747 "clinical trial" to find a scurvy cure on board the HM Bark Salisbury as a central example [Fall 2007].
Medium | Large


Random selection
Explaining the importance of randomization
This picture is an excerpt from a sequential picture presentation explaining why randomization is important in experimental design. This expands upon the 1747 scurvy "clinical trial" on the HM Bark Salisbury example above [Fall 2007].
Medium | Enlarge


Mayer graph
Cartooon graph display | Graphs display evidence. Usually, the explanation that directs a viewer's attention to the significant parts of a graph are found outside of the graph, in the main text of a document.

In contrast to this normal practice, this picture uses a cartoon “presenter” to describe the significant evidence that a reader should see in a graph. The goal was to memic techniques used by live presenters [Fall 2007]. MediumEnlarge


Download the entire presentation here as a .ppt