 I've involved a research project "Wired Cities" looking at the
effects of Internet Communication Telecommunication (ICT) on
mobility decisions. This graph created using R indicates the
rate of Internet use at any locations in relation to the GDP at
provincial level cross Canada.
I've involved a research project "Wired Cities" looking at the
effects of Internet Communication Telecommunication (ICT) on
mobility decisions. This graph created using R indicates the
rate of Internet use at any locations in relation to the GDP at
provincial level cross Canada.
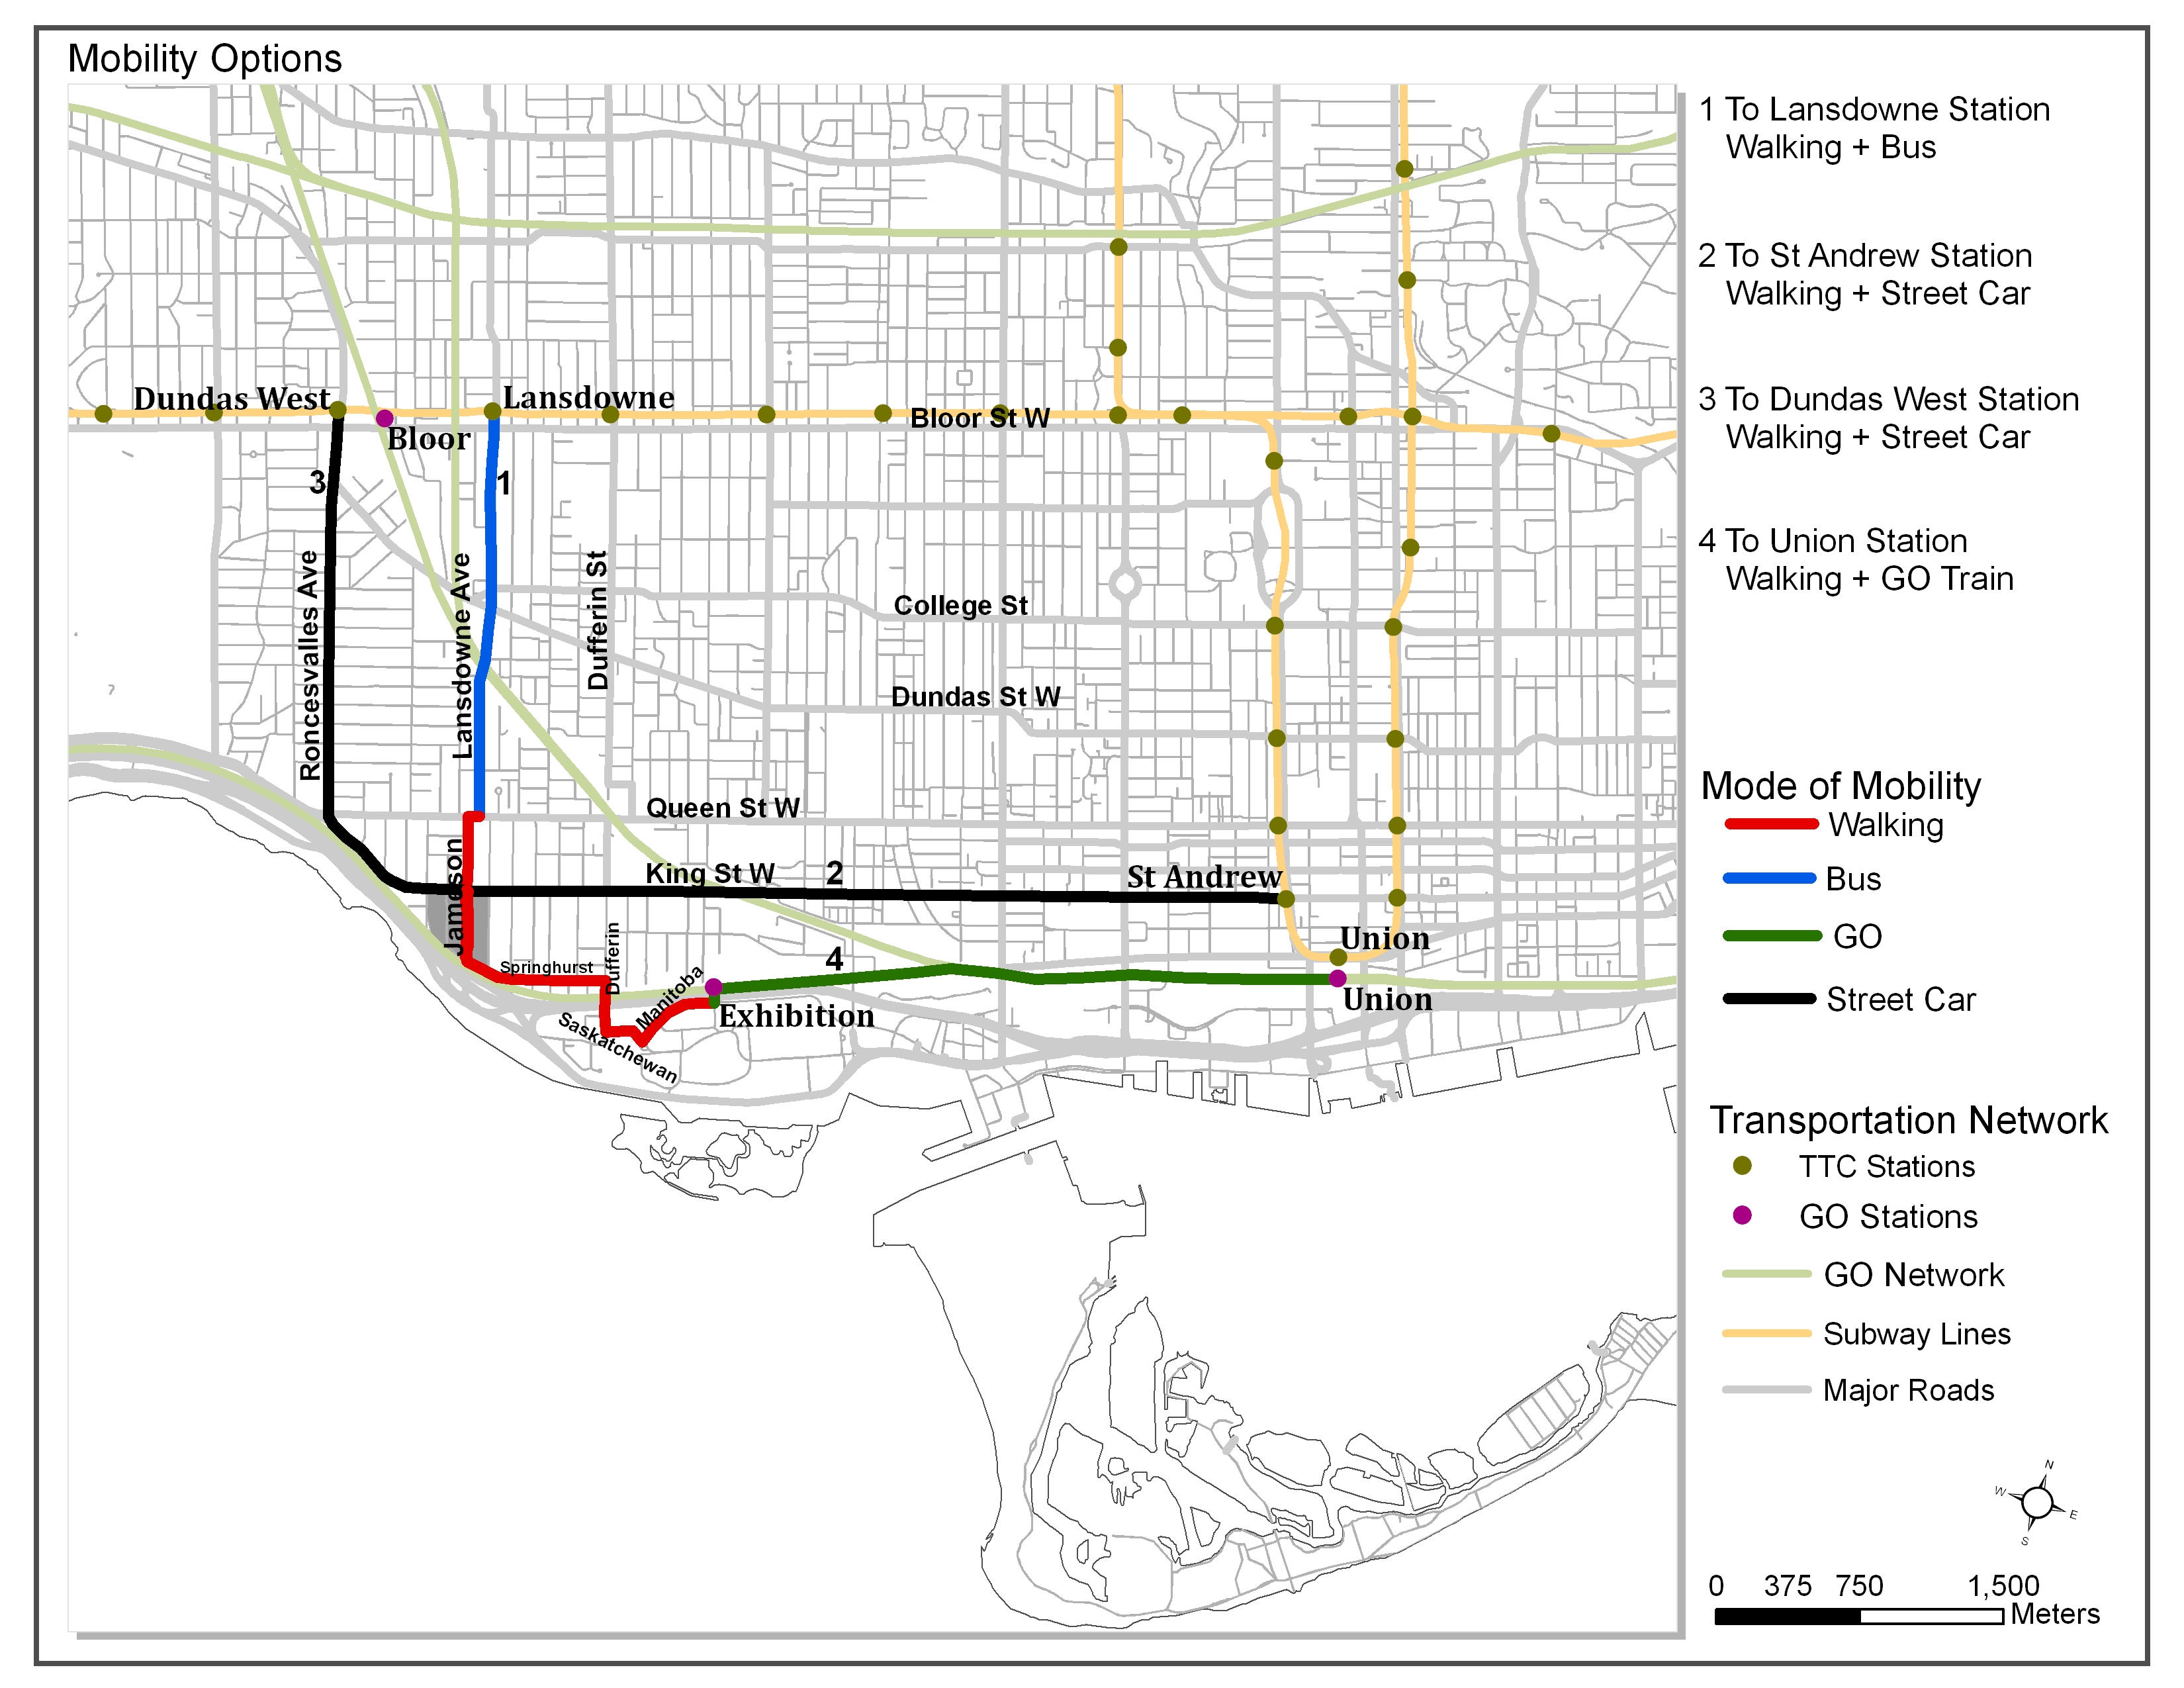 A map describing mobility options for Jamson neighbourhood in
southwest of downtown Toronto. Jamson area is connected to two major
subway lines through bus and street car service: the St. Andrew
Station to Yonge line and the Dundas West and Lansdowne Station to
Bloor line. As this map indicates, Jamson area has also access to
three GO Transit stations, Bloor station, Exhibition Station and
Union Station.
A map describing mobility options for Jamson neighbourhood in
southwest of downtown Toronto. Jamson area is connected to two major
subway lines through bus and street car service: the St. Andrew
Station to Yonge line and the Dundas West and Lansdowne Station to
Bloor line. As this map indicates, Jamson area has also access to
three GO Transit stations, Bloor station, Exhibition Station and
Union Station.
 A poster "Scaling the Digital Divide: A Canadian Story". This poster
is used of three datasets: (1) the 2008 International
Telecommunication Union (ITU) World Telecommunication ICT
Indicators, (2) Broadband statistics from the OECD, and (3) data
from Canadian Internet Use Survey (CIUS).
A poster "Scaling the Digital Divide: A Canadian Story". This poster
is used of three datasets: (1) the 2008 International
Telecommunication Union (ITU) World Telecommunication ICT
Indicators, (2) Broadband statistics from the OECD, and (3) data
from Canadian Internet Use Survey (CIUS).