
Example 4:
Let Y denote the number of 5's in 72 tosses of a dice. Then E(Y)= 72(1/6)=12. That is, we would observe 12 5's in 72 tosses of a dice. VAR(Y)=72(1/6)(5/6)=10, and STD(Y)= 3.16.
Assume that you are rolling an unfair dice. The probability of rolling each number is given in the table below. Let Y denote the number of 2's in 50 tosses of a dice.
y |
1 |
2 |
3 |
4 |
5 |
6 |
| p(y) |
0.1 |
0.2 |
0.1 |
0.2 |
0.1 |
0.3 |
Solution
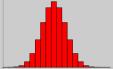 The shape of the binomial distribution depends on the value of the parameters n and p. If p=1/2, then the distribution is symetric about n/2. For p!=1/2 (p not equal to 1/2), the distribution is asymetric. The degree of asymetry increases as p approaches 0 or 1 and decreases as n increases.Use the applet to verify these characteristics. Help!
Example 5:
Let Y be a binomial random variable with n= 8 and p= 0.3. Using table 2 in Appendix A of the text book, we find that
P(Y>5)=1-P(Y£5) =1- 0.9887=0.0113
P( 2 £ Y £ 5)= P(Y£5) - P(Y£2)=0.9887-0.5518=0.4369
Round all answers to 4 decimal places.
| n |
6 |
9 |
20 |
| p |
0.65 |
0.45 |
0.15 |
| Range |
P(Y>2) |
P(3 £ Y£ 7) |
P(Y£6) |
| Answer |
|
|
|
Solution
This applet can also be used to calculate cumulative probabilities of binomial random variables for given values of n and p. Use the applet to calculate the following probabilities. Help!
Round all answers to 4 decimal places.
n |
100 |
60 |
300 |
p |
0.33 |
0.21 |
0.60 |
Range |
P(Y=<49) |
P( 11£ Y £ 47) |
P(Y>=180) |
Answer |
|
|
|
Solution
Useful Web Resources
Bernoulli Trials and Binomial Random Variables
Random Variables and Distributions
The Bernoulli Random Variable -www.math.mcmaster.ca/canty/teaching/stat2d03/lectures4.pdf
Solutions
Solution to Example 3
A: Since order does not matter the we use 15C12 to find the total number of ways we can have 12 correct answers and 3 incorrect answers. The probability that 12 questions are correct is (0.25)^12, and the probability that the 3 remaining questions are incorrect is (0.75) ^3.
So we get P(Y=12)= (15C12)(0.25)^12 (0.75)^3 =0.00001144=1.144 x 10^(-5)
B: P(Y>13)= P(Y=14) + P(Y=15)= (15C14)(0.25)^14 (0.75) + (15C15)(0.25)^15=5.6810 x 10^(-8)
Solution to Example 4
A: P(Y=2)= p =0.2
So 1-p = 1-0.2 = 0.8
So E(Y)=50(0.2)=10 and
B: VAR(Y)=50(0.2)(0.8)= 8
Solution to Example 5A
P(Y>2)=1-P(Y£2)= 1-0.11740= 0.8826
P(3 £ Y£ 7) =P(Y£ 7) - P(Y£ 3) =0.9909-0.3614=0.6295
P(Y>6)=1-P(Y£ 6)=1-0.9781 =0.0219
Solution to Example 5B
P(Y=<49)=0.9996
P( 11£ Y £ 47) =0.7413
P(Y>=180)=0.5250
HELP
Click on the icon at the side and a Web page will open up. Scroll down until you find an applet labeled Binomial Distribution. Enter a value for n and p and press Rescale. The diagram will change accordingly.
HELP
For n=100, p=0.33 find P(Y=<49):
Enter n=100 and p=0.33 into the boxes labeled n and p respectively on the applet. Click Rescale. Click on the button labeled Prob found at the top of the applet, and select x<=b. A box will appear asking for the user to input an upper bound. Enter 49 and click OK. The diagram highlight the range specified in red. The probability of that range will appear in red at the bottom of the applet.
The other questions are done similarly.
.
.
