Selection of my Data Science projects:
Unsupervised Clustering — Original Research
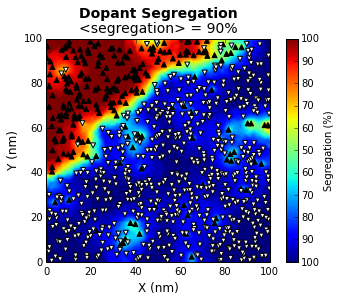
- Objective: Analyzing the clustering of dopants in graphene.
- Data: Dopant coordinates (in nm) and sublattice positions (A or B).
- Method of Analysis: Developed an unsupervised clustering model via Spatial Autocorrelation Analysis.
- Outcome: Achieved detection of clusters with arbitrary sizes and shapes, and also determined the number of clusters in the system — much improved performance compared to common clustering and classifications techniques such as k-Means, Logistic Regression, or Support Vector Machines (SVM).
- Source code in iPython provided here.
Recommender Systems — Content-Based vs. Collaborative Filtering

- Objective: Providing movie recommendations based on users' prior ratings.
- Data: 100,000 movie ratings from 1000 users on 1700 movies, downloaded from GroupLens.org.
- Methods of Analysis: (1) Content-based filtering: modelled the user ratings based on movie genres using SVM. (2) k-Nearest Neighbors (kNN): predicted the ratings based on user similarity. (3) Collaborative filtering: concurrently optimized both the movie features and user preferences via linear regression.
- Findings: Collaborative filtering yields a higher accuracy than the other two popular approaches which use only one set of parameters (movie genres in 1, or user similarity in 2). Also, since collaborative filtering does not require prior knowledge of movie features, it is very versatile.
- Source code in iPython is provided here. For a presentation in Tableau see here.
Text Classification — Spam Filtering
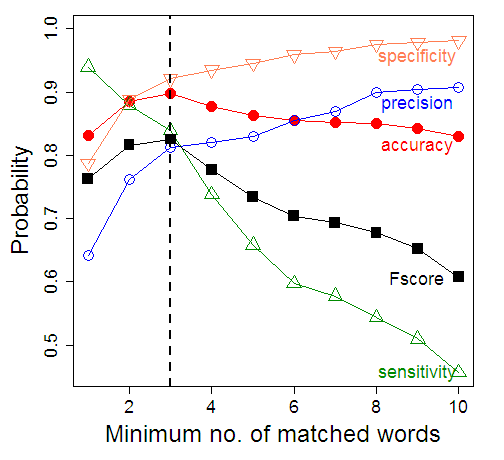
- Objective: Optimizing model parameters for text classification.
- Data: Enron emails grouped into spam and ham categories.
- Method of Analysis: Performed text mining in R using the tm package. Developed a Naive Bayes model to calculate the spam probability of words.
- Outcome: Optimized the model by tuning hyperparameters such as the posterior probability threshold and the minimum number of matched words.
- Source code in RStudio provided here.
Data Mining with R — Census Income

- Objective: Income prediction based on the census data.
- Data: Personal information such as age, gender, education, etc. — downloaded from http://archive.ics.uci.edu/ml/datasets/Adult
- Method of Analysis: Performed feature selection via exploratory data analysis and correlation analysis in R. Predictive modeling using Logistic Regression and Decision Tree.
- Outcome: Achieved similar prediction accuracies with logistic regression and decision tree, provided that features are selected properly to avoid overfitting.
- Source code in R provided here.
Data Analysis with Python/Pandas — US Employment
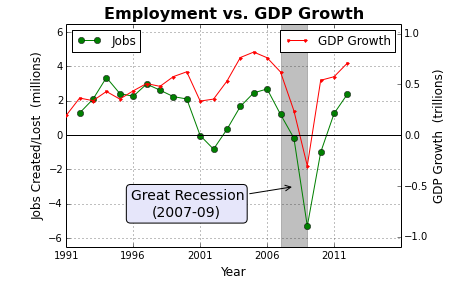
- Objective: Performing trend analysis between employment rate and economic growth.
- Data: U.S. economic indicators — 103 categories in total — downloaded from WorldBank.org
- Method of Analysis: Data mining using Pandas and visualization using Matplotlib in Python.
- Outcome: Found strong correlation between employment rate, job creation, and GDP growth.
- Source code in Python provided here.
Natural Language Processing — Twitter Sentiment Analysis
- Objective: Analyzing the sentiment scores of tweets based on geographical location.
- Data: Live stream of tweets retrieved from Twitter API.
- Method of Analysis:
- Request and collection of live tweets from the Twitter Streaming API using Python.
- Performing sentiment analysis using AFINN lexicon and the Natural Language Toolkit (NLTK) package in Python.
- Data visualization with D3.js. - Visualization in JavaScript and source code in Python provided here.
Interactive Data Visualization — Interstate Migration
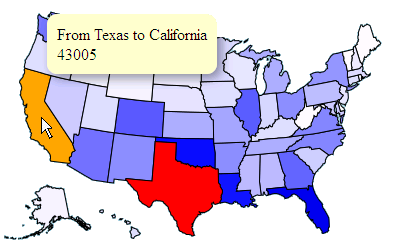
- Objective: Using D3.js for visual exploration of data.
- Data: Interstate migrations downloaded from U.S. Census Bureau.
- Outcome: Visualizing the migration statistics among the U.S. states by interactively clicking on the map.
- Implementation in JavaScript provided here.
Image Processing — Image Symmetrization
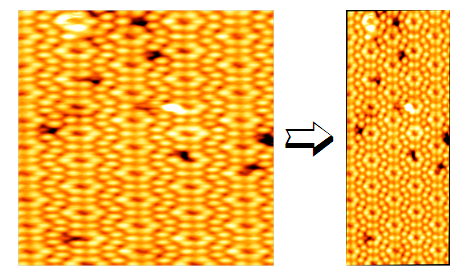
- Objective: Symmetrizing image via FFT analysis
- Data: Microscopy image of Si(111) surface — original research
- Method of Analysis: Symmetrizing the 2D FFT image by fitting an ellipse to FFT peaks and subsequently transforming the ellipse into a circle. Then apply the inverse transformation on the original image.
- Source code in Matlab provided here.