|
|
Naomi NagyLinguistics at U of T |
LIN 1256: Advanced Language Variation & Change
Language Contact, Corpora & Analysis
Course Description * Schedule * Reading * Assessment
LIN 1256 - ELAN and Rbrul HW
| Due dates | Task |
|---|---|
| Coding HW (complete by Week 4) | |
| Analysis HW (due Week 7) | |
Part 1: Defining Dependent Variables
Part 2: Getting set up
The purpose of these assignments is to give you hands-on experience with extracting, coding, and analyzing a linguistic variable from natural speech data, using a specialized freeware packages, ELAN, for transcribing and coding data; and Rbrul, a package that runs in R, for statistical analysis.
This is what (variationist) sociolinguists actually do, so you’ll get a chance to see how each step of the research process works. For this project, we will all work on the same sociolinguistic variable: the pronunciation of (r) in Boston English. If you are already comfortable using Goldvarb, and have other data that you will be working with for this course, check with me about substituting that data instead.
Step 1: Download the following paper (from http://repository.upenn.edu/pwpl/vol13/iss2/11/).
Irwin, T. & N. Nagy. 2007. Bostonians /r/ speaking: A quantitative look at (r) in Boston. Penn Working Papers in Linguistics 13.2. Selected papers from NWAV 35. 135-47.
You may need to do a quick read of this article in order to understand the issues involved in the study of the variable (r). Later in the term, as part of the discussion of quantifying contact effects, we will discuss a follow-up article with more details:
Nagy, N. & P. Irwin. 2010. Boston (r): Neighbo(r)s nea(r) and fa(r). Language Variation and Change 22:2.241-78. [see abstract]
A number of data files are required for this project. They are all located in the Corpora in the Classroom server.
Step 2: From Corpora in the Classroom, select the "New England Blizzard" corpus. Download two of the six audio .wav files and the matching .eaf files. (You will need to accept the Corpus Use Form first.) Save the files together in a folder on a computer that you will be able to find and use all semester.
You must agree to the conditions of use of our data files before you may use them. You will be asked to indicate your understanding of the conditions of use via an online Corpus Use form in the Corpora in the Classroom website. No assignments can be accepted for credit unless you have "e-signed" this form.
The .eaf files are the transcribed recordings that will serve as your raw data files. There is no need to print these files. Rather, read through these instructions first, which include tips on how to deal with these data files. This document will guide you step-by-step through the assignment and the analysis.
THE SAMPLE DESIGN: We will be working with data from six speakers, all from Boston. Ideally, each of you will pick different speakers/tokens to code. Here is some info about the speakers.
Speaker code |
Sex |
Age |
|---|---|---|
F27A |
female |
27 |
F57A |
female |
57 |
F70A |
female |
70 |
M18A |
male |
18 |
M33A |
male |
33 |
M65W |
male |
65 |
Step 3: Download the software program ELAN and install it on your computer. ELAN is freeware that runs on Mac, Windows and Linux. On this Download page you will also see links to the User Guide and Manual for ELAN, which you can read online or download. (Instructions below are geared toward the Mac OS X version, but it should work very similarly on other operating systems. The online manual is written more for Windows users.)
Note: It will simplify things to install the application in the same folder as the .wav and .eaf files you will use -- this should be an option at least for Mac-users.
[Return to top] [Return to syllabus]
Part 3: Set up ELAN and mark 25 (r) tokens in ELAN for each speaker
-
Start ELAN.
- Choose Open from the File menu and select one of the .eaf files that you downloaded. "eaf" indicates an ELAN Annotation File.
- You may be asked to locate the .wav file that has the same name as the .eaf file, or ELAN may find it automatically.
- Choose AUTO BACKUP > 1 minute from the File menu. Although this should make ELAN save your file every minute, please select "Save" from the "Edit" menu regularly as you work. Back up onto a different disk at the end of every work session, at least. Losing the work you have done when/if your computer crashes is NOT a valid reason for an extension, unfortunately.
- Immediately save your file as YOURLASTNAME_YOURFIRSTNAME_SPEAKERCODE.eaf. For example, I might create "NAGY_NAOMI_F70A.eaf." (The program will add the ".eaf" suffix to indicate that this is an ELAN Annotation File.)
- In the Tiers menu, choose Change Tier Attributes. Type your name in the Annotator field for the following tiers:
- tokens
- dependent variable
- preceding vowel
- following context
- Put on headphones that are plugged into your computer.
- You should see a soundwave in the center of the ELAN window. (Have a look at this picture) If you don’t see the wave, Command-Click or Right-click on the place where the soundwave should be (it will be showing as a flat horizontal line). This creates a pop-up menu. Choose a number to magnify/Vertical Zoom by. (See ELAN manual on vertical zoom.) Test and adjust your volume. (Apple menu > System Preferences > Sound > Output for a Mac).
- Click around on some buttons in ELAN and explore what they do. (Hovering over most of them will bring up an indicator of their function.)
- In the Options menu, make sure Annotation mode is selected.
- In the tabs that run across the top of the soundwave window, select Controls to adjust volume and speed of playback. Then switch to the Grid tab. Here you will see a list of everything that has been transcribed in the selected tier, along with the timepoints at which each items started end finished. There's a pull-down menu above the tabs from which you can select different tiers to view in "grid view."
- Your window should look like this.
- Find and label tokens of your dependent variable.
- In the tier labeled "tokens," create an annotation field that corresponds to the syllable in the .wav file where the first (r) is spoken. To do this, highlight a portion of the .wav. Listen (Shift+S, or click the Play button with the blue triangle) and see if it's the right part. If not, keep looking and listening. When you have highlighted the right section, double-click in the "tokens" tier to create an annotation field in which to code that token. When you double-click, a field will be created that is the size of the portion of the .wav that you highlighted. That field, and whatever text you type in it, is time-linked to that part of the .wav. Afterwards, you can click that field and hear the corresponding syllable.
- In the annotation field, type the word that contains the (r).
- Continue through the file, following the principle of accountability, to label the first 25 words containing an instance of (r). (In a word like "harder", which contains two tokens of (r) you could mark one syllable as "harder1" and the other as "harder2".)
- Circumscribe the variable context. “Circumscribing the variable context” means determining what tokens will be included in your analysis and what will not be included, with principled reasons. Although you should mark all instances of syllables that appear to contain (r) (up to 25/speaker), i.e., /r/ in a syllable coda, you might later exclude some tokens when you make your distributional analysis charts (See Part 7 below).
- Be sure to only code coda /r/s, NOT any /r/s that appear in the onset of a syllable.
- Analyze the data from the main speaker only. Ignore anything said by anyone other than the main speaker (the speaker for whom the file is named) for this assignment.
- If there are any tokens you can't decide whether to include or not, create a "Notes" tier and make a note at the appropriate timepoint.
- Code your dependent variable.
- In the tier labeled "dependent variable," create an annotation field that corresponds to the syllable in the .wav file where the first (r) is spoken (the field in your "tokens" tier). To do this, click the field in the "tokens" tier to highlight in. Then click in the "Dependent variable" tier just below the highlighted annotation field in the "tokens" tier. (A field will be created that is the same size as the field in the "tokens" tier.)
- In each annotation field in the "Dependent variable" tier, type "r" if you hear the [r] pronounced. Type "0" (zero) if you hear only a vowel, but no consonantal [r]. Hit "enter" after typing in the appropriate code. This will save what you typed and move the cursor out of the annotation field.
- Once you have marked and coded the first few tokens, your file should look something like this.
- To check if you are on the right track, export your file as a tab-delimited text file.
- In the File menu, choose "Export as..."
- Select "Tab-delimited Text"
- Under Select Tiers, click the boxes for "main speaker", "tokens" and "dependent variable."
- Under Output options, select the boxes for "Separate column for each tier" and "Repeat values..."
- Click "OK" and then "Close."
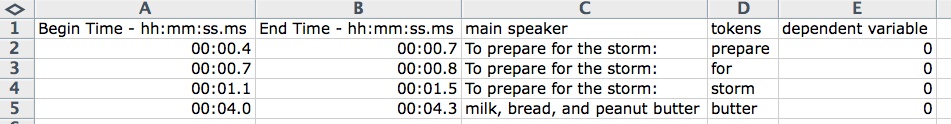
Open the newly created .txt file in Excel. (If you get the Import window, just click "Finish.") Somewhere in your .txt file (you may need to scroll to the bottom), there should be a few rows that look like this:
Note: Capitalization matters when you are coding tokens! "R" will not be seen as the same thing as "r" when you start running your analyses.
- Follow the same procedure to mark and code at least 25 tokens of (r) for 2 speakers.
[Return to top] [Return to syllabus]
Part 4: Code the independent linguistic variables in ELAN
For this Part, you will be working with the two ELAN .eaf files that you created in Part 3.
Note: Capitalization matters when you are coding tokens! "e" will not be seen as the same thing as "E" when you start running your analyses.
Code each of the tokens for two independent variables. To do this, highlight a token, then click in the relevant tier ("preceding vowel" or "following context"), right below the token. In the new field that appears, type in the 1-letter code that describes appropriate context. Be sure to code what you hear, not what the spelling suggests -- this may vary across speakers. If you need to make any notes about questionable tokens, etc., type them in the "Default" tier so you can find them later.
Categorize what you find in the data using the following coding scheme as a start. If you find a token that does not fit the existing categories, you can make up a new category and use it. Make sure to make a note of what your new abbreviation means and submit that with the assignment.
Independent linguistic variable #1: Preceding vowel Code IPA Symbol Description Example word i i or ɪ high front "beer" e e or ɛ mid front "bear" a ɑ, a or æ low "bar" (for some speakers, some tokens) o o or ɔ mid back "bore" u u or ʊ high back round "boor" (or "Bloor") 2 schwa unstressed mid central (schwa) "runner" 3 wedge stressed mid central (caret) "purchase" x glide glides or other sounds "your" as [jr] or "p'ticipate"
Independent linguistic variable #2: Following contextCode Description Example v Word-final, preceding a vowel "car is" p Word-final, preceding a pause "car." c Following consonant, in the next morpheme and in the next syllable "wintertime" d Following consonant, in the next morpheme but the same syllable "winters" s Morpheme-internal (Following consonant, in the same morpheme) "card" You can find more examples for each variant in the reading.
Your file should now look something like this.[Return to top] [Return to syllabus]
Part 5: Export your coded tokens
Your ELAN file should now look like this (except it won't have a tier for social factor coding).
Once you have coded both files, check your coding for accuracy and consistency.
The next step is to export your coded data, along with the transcription and timestamps, to a text file for statistical analysis.
To export a file:
- In ELAN, choose Export as Comma-delimited Text from the File menu. (If you are brave, you can experiment with the Export Multiple Files As function.)
- In the Select tiers box, click main speaker , tokens, and the tiers for all the variables you coded (dependent and independent, linguistic and social).
- In Output options, click "Separate column for each tier" and "Repeat values..."
- In Include time column for, click "Begin Time" and "End Time."
- In Include time format: click on the first box.
- Click OK.
- Name the file SPEAKERCODE_YOURLASTNAME_YOURFIRSTNAME.csv when you save it.
- Follow the same process for all speakers you have coded.
To prepare your data to turn in for Week 4:
- Open each .csv file (one for each speaker) in Excel.
- Add a column to the right of the filled columns. Put "Speaker" in the header. Fill in the speaker code for each token, so that when you combine the files (next step), you can see who produced each token.
- Paste the contents of each file, one below the other into one Excel file. Make sure the same kind of information appears consistently in each column, for all the speakers.
- Save this new Excel file as YOURLASTNAME_YOURFIRSTNAME_LIN1256_tokens.xls.
- Select All.
- From the Data menu, choose Sort.... Sort by "social factor codes" and then by "Begin Time."
- After sorting, please delete all the rows that do NOT contain tokens. (They will have nothing in the "Begin Time" or "Dependent variable" columns, so it's easy to select them all and delete in one action.)
- Save As... YOURLASTNAME_YOURFIRSTNAME_LIN1256_r_tokens.csv. (This is a comma-delimited text file format.)
Tip: When you work with a more complex file of your own data, if you include the sentences related to each token, save as tab-delimited (.txt), rather than comma-delimited, to avoid confusing Rbrul by the commas inside any sentences. For this assignment, there are no commas in the tokens, so no problem.
- Submit this .csv file electronically in the Assignments section of Blackboard.
- You will need the token file created by concatenating (combining) each student's .csv file from Part 5. Download it from Blackboard.
- Read a little about Rbrul.
- Bookmark the Rbrul manual.
- Download Getting started with Rbrul (by Meredith Tamminga)
- Follow all the steps in Getting started with Rbrul.
- Play with your data in Rbrul a little more. See what patterns you can find.
- Make sure that all your factors (independent variables) are all "factors," and not "integers." Use the Adjust Data menu to fix any problems.
- Check that each variable has the variants you expect. Use the Adjust Data menu to fix any problems. Experiment - be brave and bold. If you make a mistake, you can always reload your data (.csv) file and start again.
- Select the Modeling option from the main menu.
- Select "one-level analysis" to get a first overview of your data. This will give you a general overview of the tokens and patterns you have.
- You will be asked to select the application value of your dependent variable. This means, "how will the dependent variable be examined?"
- Then you will be asked to select the independent variables you want to include in the model.
- Ignore the options for continuous, interaction and random effects, for now.
- To see the results, scroll back up in the R window after it completes the analysis. You should see something like this:
Output from a one-level model in Rbrul At the top, you see the factors that you put into the model, along with a measure of the significance (p-value) for each. Next, is a table for each independent variable (factor) in your model.
As you can see from the column headers, the columns tell you:1. each variant or "factor" 
2. the logodds, or how much that variant favours the application value (in our case, [r]) 3. the number of tokens in that category 4. the percentage of those tokens which have the application value (coded in this example as "1")--counted from the data. This is labeled as a fraction with the application value before the slash and the sum of all values considered after the slash 5. the "centered factor weight" or the probability of a token having the application value in this context -- calculated from the model At the bottom of the table is important information about the model. See the Rbrul manual to interpret. Below the table, you see a list of all the variables considered for this model ("Current variables are:"). (In a one-level analysis, this will be the same as the factors listed at the top.
In a step-up/step-down, it is possible that not all factors will be selected as significant. There, only significant factors are shown at the top, but all factors considered are listed at the bottom. - Look at the output carefully. Can you identify which column shows the number of tokens in each category? Which shows the rate of r-lessness? Do you see the factor weights? We will ignore the factor weights for now.
- Copy the full model into an Excel spreadsheet and save it. Tip: Use Courier font to get the numbers to line up in nice columns.
- Save the Results file under an appropriate name (LIN1256_Last-Name_First-Name_R_Results1.xls).
- Provide an overall distribution of the dependent variable in the data, as per the following template. Format and label it as in this example:
- Create a second table, similar to Table 1, but that provides a distributional analysis for the social variables.
This assignment will not be marked. You are submitting the file so that they can be concatenated and combined to form one bigger token file on which you will continue to work for Week 7.
[Return to top] [Return to syllabus]
Part 6: Getting started with Rbrul
At this point, we transfer the data from Excel to Rbrul, a package for conducting distributional and multivariate analysis in R. We will use Rbrul to conduct our analysis. It’s a statistical program created just for sociolinguists. It can provide counts (N), percentages (%) and factor weights (FW) showing how frequently the different variants of your dependent variable appear in various contexts. Although you could do counts and percentages in a spreadsheet program like Excel, Rbrul allows you to go one step further to a multivariate analysis. These allow you to see how much effect each independent variable (aspects of the context: linguistic, social, and stylistic) has on the dependent variable (the phenomenon you’re studying).
[Return to top] [Return to syllabus]
Part 7: Distributional analysis using Rbrul
First, make sure your Token file (from Part 6) is open in Rbrul. (Remind yourself how to get there with Getting started with Rbrul.)Adjust Data
This is where you make sure that Rbrul properly understands the codes you've assigned to each token, and you choose how to sort/group your data. For starters, you do a general sort of all your data, to show the distribution of each dependent variant with respect to each variant of the independent variables.
See your first results
[Return to top] [Return to syllabus]
Part 8: Report the overall distribution of the dependent variable in the data
| Linguistic variables | % [r-1] | N [r-1] | Total # of tokens in the category |
|---|---|---|---|
Preceding vowel |
|||
|
30 |
3 |
10 |
|
40 |
4 |
10 |
|
50 |
10 |
20 |
|
|||
Following context |
|||
|
40 |
4 |
10 |
|
50 |
1 |
2 |
|
|||
TOTAL |
45 |
135 |
300 |
Note: the numbers in these table templates are made up! You will have to replace them with your own numbers and your own categories, depending on what you find in your data.
Submit Tables 1 and 2. Use the same type of naming convention as above.
So, far, you have been doing univariate analysis – looking at only one independent variable at a time. In Part 9, you will conduct an analysis with several independent variable considered simultaneously. This is very important when your data set does not have a balanced distribution of every combination of every independent variable. That is, when you are dealing with real world data.
[Return to top] [Return to syllabus]
Part 9: Factor Weights
Preparing for multivariate analysis
For this part of the project, you want to conduct an analysis that examines the tokens from all speakers together. You need to upload and use a token file that has the tokens for all six speakers in it.
Use [r-1] as the application value. Be sure to properly label what is being counted, in your tables.
In order to find out which variables have a significant effect, you must create a results file with no empty cells and no interacting factors. This may mean combining or deleting certain factors or factor groups. This process is done in the Adjusting menu in Rbrul.
Make sure you have principled reasons for the changes you make. This means that it's ok to combine, for example, following stop and following fricative if there was 95% deletion for stops and 100% for fricatives, because (a) stops and fricative are somewhat similar phonetically and (b) the numbers were fairly similar.
Practice recoding to combine and to delete certain factors. It's helpful to use the "Recode to new column" option in order to NOT overwrite the original values you coded.
See more information in the Rbrul manual that you bookmarked.
Cross-tabulation
To look for interaction between 2 independent variables (meaning an overlap in how two different independent variables divide up your tokens), choose Cross-tab from the Modeling menu and select the 2 groups you are interested in. A new table will be created which shows you the distribution of the dependent variable according to both of these independent variables. You can copy the cross-tab output to an Excel (or Word) document to save and edit it. Use Courier font to make the columns line up.
Multivariate analysis
Once you have adjusted your data to get rid of any interactions you can think of (and used cross-tabs to check), run a step-up/step-down analysis in Rbrul. This will show you which factors have a significant effect on your dependent variable.This analysis takes longer than the one-level, if you have a big token file.
It spits out a lot of text and numbers, but indicates which factors are significant.
You will notice that, generally, the factor groups it finds to be significant are those that have the biggest spread in values in the one-level analysis. If there is a lot of overlap between two different factor groups (i.e., all tokens with a following vowel having been produced by Pat), there may be differences.
If you want to look at the constraints conditioning variation for only a subset of your tokens, for example, only tokens from younger speakers, you can use the Recode function in the Adjust Data menu to exclude tokens from the older speakers. Experiment with this.
For Week 7, submit a document containing the Results file for a one-level binomial analysis for all speakers combined, as Table 3. Be sure to label all columns and rows clearly. It should be arranged like Factor Weight tables we've seen in a number of articles this semester.
|
Updated December 10, 2014 |
email: naomi dot nagy at utoronto dot ca | Return to my home page