Techniques - Tracking Huntington's Disease
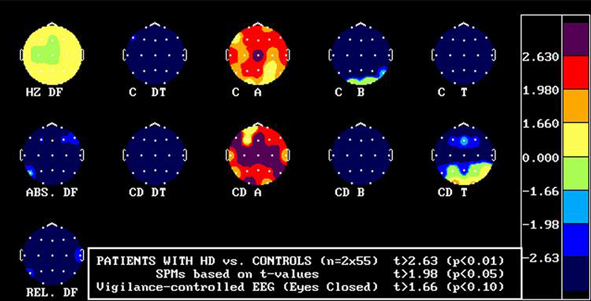
Photo: Vigilance-controlled EEG (V-EEG) showing the difference in controls and HD patients in the alpha, beta, theta, and delta frequencies. Overall, an increase in delta frequences is evident and a decrease in alpha & beta frequencies is evident in HD patients. (Credit: Painold, et al. 2010)
Numerous techniques have been employed to track the progress in HD, but whilst there are advances in creating approaches to track its progression, limitations lie in establishing subjective stages. Whilst there can be more techniques in an attempt to quantify and analyze HD over time, on one hand this may lose productivity in keeping focused with identification and manipulation of protein or immune interactions in cells expressing the mutant huntingtin gene, such as the use of an electroencephalogram to track disease progression, which may not provide as useful of a direction in creating novel strategies to deal with the disease. On the other hand, we are better able to track this disease, and in the hunt for reliable biomarkers, as stated previously, can serve as a more accurate gauge for gene manipulation.
The degeneration of neural tissue is witnessed through various techniques. Electroencephalograms have revealed general amplitude reduction or suppression of alpha waves, and compared to controls, delta waves seem to be the best indicator compared to alpha, beta, and theta waves, for gauging the progression of HD (30).
Assessing structural integrity
Analyzing the reduced density of certain regions in the brain, such as by voxel-based morphometry (31), gives some insight into localized reduction of volume over time. Position emission tomography (PET) has shown with striatal graft treatment, glucose metabolism increased with clinical improvement (32), and also showed in vivo how increased microglial activation has correlated proportionally with an increase in striatal dopamine D2 receptor dysfunction with 11C-raclopride PET (33). Indexing structural integrity of neurons in localized areas can be gauged by diffusion-weighted MRI, using apparent diffusion coefficients (ADCs) measuring the diffusion of water correlated in HD prone areas (34).
Photo: Reduced thalamic volume in HD patient via voxel-based morphometry technique. (Credit: Kassubek et al. 2005.)
Proteomic profiling in the goal to identify reliable biomarkers has been evidenced in techniques such as, immunoblotting and enzyme-linked-immunosorbent serologic assay (ELISA), with CSF and R6/2 mice. Semiquantitative immunoblotting has shown that levels of alpha and beta clusterin, which has cytoprotective properties and involved in membrane recycling (35), are increased throughout HD progression. This signifies that the body is constantly trying to repair affected HD neurons, however, this protein serves as an indicator that it’s obviously insufficient, not enough is produced, or has no effect on HD progression.
Photo: Semiquantitative immunoblotting studies to determine alpha and beta clusterin expression. Proteins 1713 and 1960 upregulated in HD patients who participated in the trial. These proteins demonstrate inflammation present and may be a potential biomarker. (Credit: Dalrymple et al. 2007)