

 |
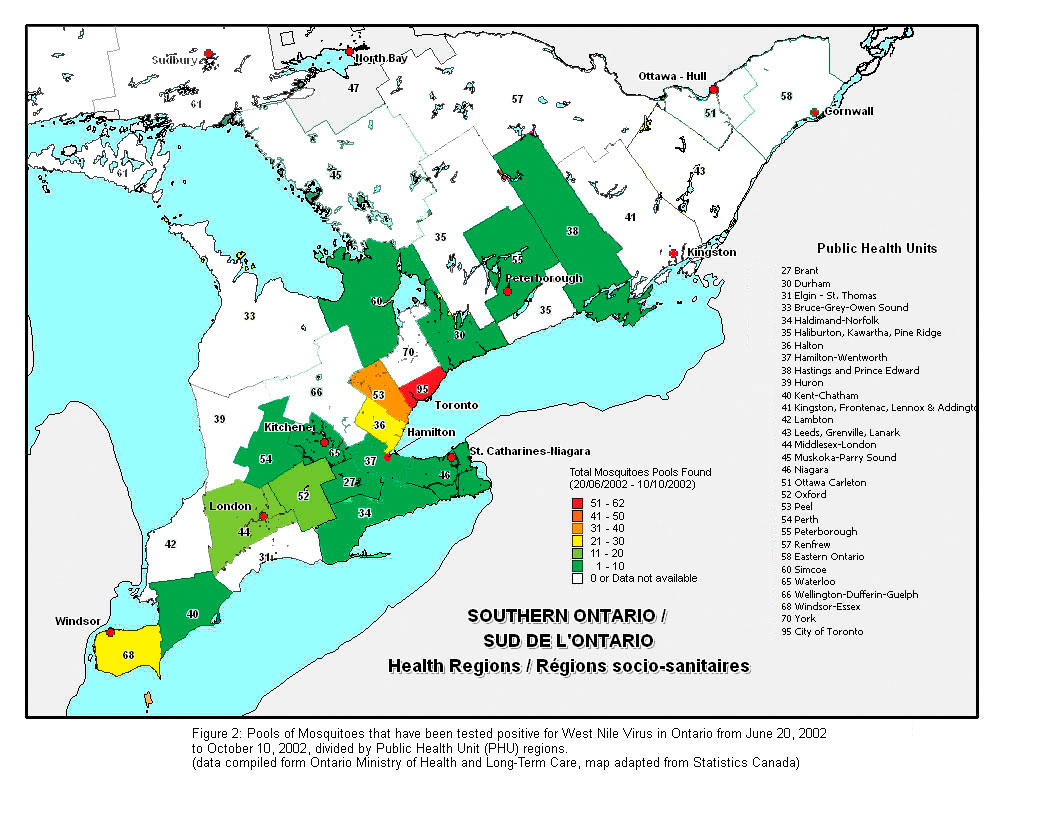
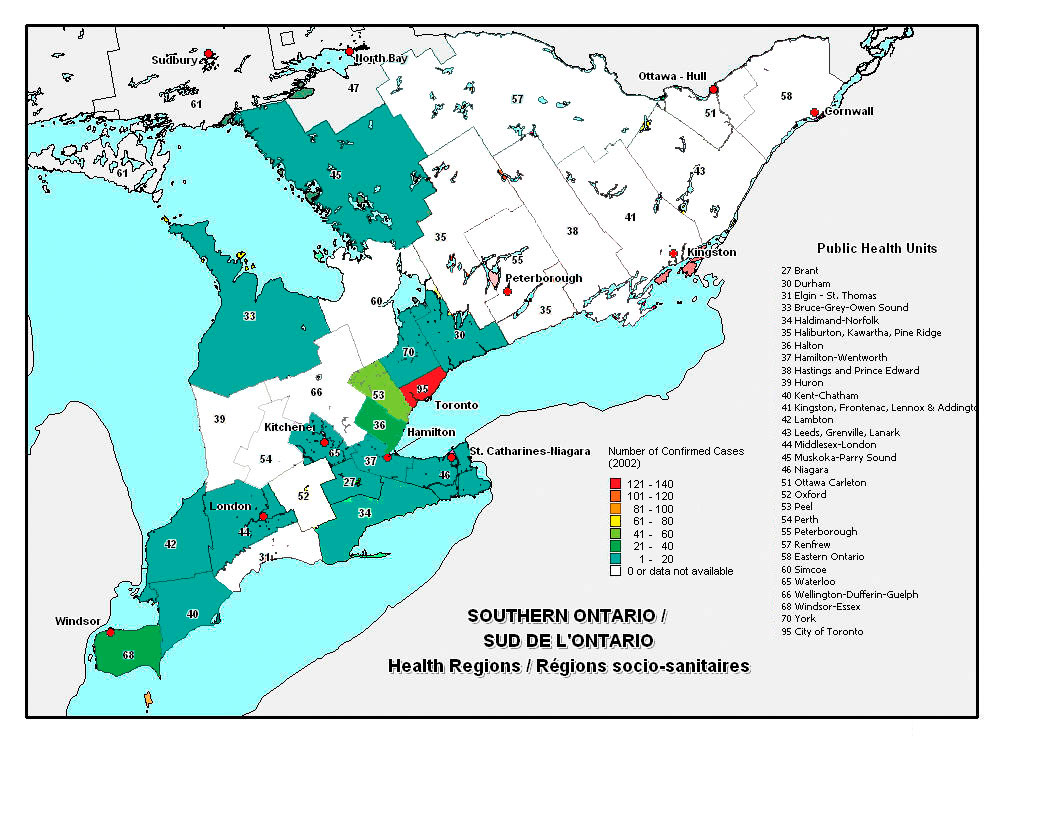
The Ontario SituationThree maps showing the geographical distribution of birds, pools of mosquitoes, and humans positive for West-Nile Virus in the summer of 2002 in Southern Ontario. Each map is divided into Public Health Unit (PHU) regions as defined by the Ontario Ministry of Health and Long-term Care. The number of confirmed cases is colour-coded into 7 gredations, with the highest being red and the lowest being cyan. Data obtained from the Ontario Ministry of Health and Long-term Care and the map is adapted from Statistics Canada.
West Nile Virus Analysis : Geographic Distribution of Birds Positive for West-Nile Virus - note the longitudinal hot-zone stretching from Niagara penisula to Lake Simcoe. Geographic Distribution of Pools of Mosquitoes Positive for West-Nile Virus - Toronto has the highest density, followed by the region of Halton-Peel, and Windsor. Geographic Distribution of Humans Positive for West-Nile Virus - Toronto has the highest density, followed by the region of Windsor. Electronic Resources : Ontario Ministry of Health - providing updates on West-Nile virus in Ontario. Health Canada - providing updates on West-Nile virus across Canada. |
![]()
Last Modified: