/
|
LIN 351H1S 2011
|
||||||||||||||||||||||||||||||||||||||||||||||||||||||||||||||||||||||||||||||||||||||||||||||||||||||||||||||||||||||||||||||||||||||||||||||||||||||||||||||||||||||||||||||||||||||||||||||||||||||||||||||||||||||||||||||||||||||||||||||||||||||||||||||||||||||||||||||||||||||||||||||||||||||||||||||||||||||||||||||||||||||||||||||||||||||||||||||||||||
| Assignment | Due date |
What to turn in |
|---|---|---|
Jan. 26 |
Description of 10 variables | |
Mar. 2 |
Token file in Excel & Appendix of Exclusions | |
Mar. 23 |
Tables 1-4 | |
Mar. 30 |
Table 5 | |
Apr. 6 |
Essay |
Be sure to put your name and student number at the top of each assignment.
Part 1: Defining Dependent Variables
Part 2: Getting set up for the mini-project
The purpose of the rest of the assignments for this course is to:
- give you hands-on experience with extracting, coding, and analyzing a linguistic variable from natural speech data, using a specialized freeware package called Goldvarb.
- provide you with the opportunity to engage in the sociolinguistic discovery process
- give you practice comparing your results to previously published results.
This is what sociolinguists actually do, so you’ll get a chance to see how the research process works. For this project, we will all work on the same sociolinguistic variable: the use of General Extenders (GEs) in English.
Step 1: Download Dines (1980) and Tagliamonte & Denis (2010). Both of these articles are available in Blackboard. Click the “Books and Reading” button. Both can also be accessed from the University of Toronto Library’s e-journals.
Dines, Elisabeth R. 1980. Variation in discourse and stuff like that. Language in Society 9.1:13-33.
Tagliamonte, S. A. and D. Denis (2010).The stuff of change: General Extenders in Toronto, Canada. Journal of English Linguistics 38:355-367.
You will need to read these articles in order to understand some of the issues involved in the study of General Extenders (GEs) and to compare your results. Page numbers for some of the more relevant sections of these articles will be indicated in these instructions.
A number of files are required for this project. They are all located inside the "Resources for the Mini-project" folder in "Assignments" in Blackboard.
Step 2: Download the six transcription text files in Blackboard .
You must agree to the conditions of use of Prof. Sali Tagliamonte's data files before you may use them. To indicate your understanding of the conditions, print, read carefully, sign and submit the Corpus Data Use form with HW 1 or 2.
These filesare the transcribed interviews that will serve as your raw data files. Do not print these files out, they are quite long. Rather, read through these instructions first, which include some tips on how to deal with these data files. This document will guide you step-by-step through the assignment and the analysis.
THE SAMPLE DESIGN: You will be working with data from six speakers, all from the Greater Toronto Area. Here is some info about them.
1-digit speaker code |
Speaker code |
Age |
Sex |
|---|---|---|---|
1 |
017 |
21 |
female |
2 |
072 |
20 |
male |
3 |
053 |
53 |
male |
4 |
051 |
45 |
female |
5 |
022 |
83 |
female |
6 |
079 |
84 |
male |
[Return to top] [Return to syllabus]
Part 3: Extract all sentences with GEs and put them in a spreadsheet
- Using the principle of accountability, extract all the GEs in the transcription files that were produced by the informant or main speaker. Analyze the data from these speakers only. For example, [017] is the main speaker in the first transcript, while speaker [5] is the interviewer. You should ignore anything said by anyone other than the main speaker (the speaker for whom the file is named) for this assignment.
- There are some transcription conventions that you should be aware of. Transcriptions are in standard orthography. They distinguish morphological variation only, but not simple cases of phonological variation. In the case of ambiguity, we use standard orthographic conventions. These conventions were determined by Sali Tagliamonte, who constructed the corpus containing these transcriptions.
- a) Single and double digits (e.g. [1] Claire, [2] Angela) refer to interviewers and other participants, while three-digit numbers (e.g. [025], [020]) refer to informants.
- False starts are represented as follows: Whole word – (e.g. I thought- thought I saw a bear)
Partial words are represented by a double dash. These are production phenomena; they do not constitute variants! You can ignore them. (e.g. I thou- - thought I saw a bear) - Anything in between parentheses is a comment by the transcriber (e.g. (coughs) = the speaker coughed
- (inc) = the utterance was incomprehensible
- Common idiomatic phrases are hyphenated, these are some . (e.g. you-know, I-see). This may impact how you search for tokens (e.g., you will see "and stuff" but also "and-stuff"), but it is not important for your analysis.
- When extracting the data, you will need to circumscribe the variable context. See the section in the article that describes this: Tagliamonte & Denis (2010:336-9 and 346-7). Note the contexts that must be excluded and any anomalies or differences from what the two previous studies found.
“Circumscribing the variable context” means determining what tokens will be included in your analysis and what will not be included, and why not. Although you should extract all instances sentences that appear to contain GEs, you might later exclude some tokens when you make your distributional analysis charts (See Part 5 below).
- Be warned! The data files are large. Think strategically about how you will proceed with extracting the relevant data from them. A good way to tackle this is as follows: Rather than printing out the data files, open one on the screen and also open a new, empty text document in a second window. As you read through the transcript file, when you find an instance of a GE, copy the section of text (including the GE and as much surrounding context as you will need in order to code for the independent variables: see Parts 2–4, below) into the blank file. You might find a convenient way of using the ‘search’ feature of your word-processing software to help you find all the direct speech.
- Once you have finished extracting all instances (i.e. “tokens”) of GEs, you will have a nice, clean list of sentences in the new file, sorted by speaker: this is the data that you will be working with for the rest of the assignment. Despite the length of the data files, you should end up with a very manageable list of tokens. You might find several on a single page of transcript, or none at all for several pages.
- Copy this list into an Excel spreadsheet. Make sure that there is one token per cell. They should all be in one column. Use the “Fill down” feature in the “Edit” menu to place the speaker’s code number into the adjacent cell to the left of each token. At this point, your spreadsheet should look like this (not actual data):
| A | B | C | D | E | |
| 1 | Speaker | Token | |||
| 2 | 055 | I bought cookies and chocolates and stuff. | |||
| 3 | 055 | The students talked about homework and sports and things like that. | |||
| 4 | 055 | And then my mom was like, “You are having too much fun and all." |
Three formatting requests:
- Include line numbers in the Excel printout that you are handing in. To make the line numbers show in your printout, choose "Page Setup" in the File menu. Click on the "Sheet" tab and then the "Row & Column headings" checkbox. (This will make it easy to refer to tokens by number.)
- Format the token cells to "Word wrap" so that the whole token is visible if it doesn't fit on one line. You can set this (at least in Excel for Mac) by choosing "Cells" from the Format menu, then choosing the Alignment tab. You'll see a checkbox for "Wrap text." Select it.
- Make sure you set up to print so that all columns fit on one page width. You may want to set it to print "landscape" rather than "portrait. You can also select "Fit to 1 page wide." Both options are in "Page Setup" in Excel. There, you can also set it to print your name in the header/footer of each page and add page numbers.
Submit your signed Corpus Data Release Form with this assignment, unless you did so previously. No credit will be given to any student who has not submitted this form. You will find the form in Blackboard.
[Return to top] [Return to syllabus]
Part 4: Code the dependent variable
For this Part, you will be working with the Excel spreadsheet that you created in Part 3. Create one new column to the right of the Speaker column for each variable.
Note: Capitalization matters when you are coding tokens! "S" will not be seen as the same thing as "s" when you start running your analyses.
1) Code each of the tokens for the dependent variable: form of GE. Categorize what you find in the data using the following coding scheme as a start. If you find a token that does not fit the existing categories, you can make up a new category and use it.
- T = thing
- S = stuff
- h = something
- e = everything
- a = anything
- w = whatever
- X = other
| A | B | C | D | E | |
| 1 | Speaker | Token | Form of GE | ||
| 2 | 055 | I bought cookies and chocolates and stuff. | S | ||
| 3 | 055 | The students talked about homework and stress and things like that. | T | ||
| 4 | 055 | And then my mom was like, “You are having too much fun and all." | X |
[Return to top] [Return to syllabus]
Part 5: Code 3 independent variables
Column C: Noun Category
Code each of the tokens for the noun category that the GE is adjoined to. Categorize what you find in the data using the following coding scheme as a starter. Again, If you find a token that does not fit the existing categories, make up a new one:
- C = count noun
- M = mass noun
- O = other type of phrase
Cases in which the category could not be unambiguously determined should be excluded from your distributional analysis (see Part 5, below).
Column D: Type of Conjunction
Code each of the tokens according to how the GE is adjoined to the preceding clause. Again, create additional categories if necessary.
- O = disjunctive (or)
- A = adjunctive (and)
Incomplete or incomprehensible tokens, where it is impossible to ascertain how to code any of the variables, should be excluded from the analysis. The best way to do this is to code them with an “X” for that variable.
If you aren’t certain what kind of “additional categories” could be categorized here, refer back to the articles. If you feel that a token cannot be unambiguously coded for a particular variable, indicate why.
Column E: Length of GE
In the next column, code to distinguish between short GEs, such "and stuff" and long GEs, such as "and stuff like that."
- S = short, like "and stuff"
- L = long, like "and stuff like that"
- X = other
For Parts 1–5: Print out your token file with all the examples you extracted and how you coded each token for each variable (Form of GE, Noun category, Type of Conjunction). Please include a list of exclusions as well, and why you excluded any token. The list of Exclusions should be included as an Appendix with your assignment.
| A | B | C | D | E | F | |
| 1 | Speaker | Token | Form of GE | Noun category | Type of Conjunction | Length of GE |
| 2 | 055 | I bought cookies and chocolates and stuff. | S | C | A | S |
| 3 | 055 | The students talked about homework and stress and things like that. | T | M | A | L |
| 4 | 055 | And then my mom was like, “You are having too much fun and all." | X | O | A | L |
[Return to top] [Return to syllabus]
Part 6: Getting Goldvarb started
At this point, we transfer the data from Excel to Goldvarb. We will use Goldvarb to conduct our analysis. It’s a statistical program created just for sociolinguists. It can provide counts (N), percentages (%) and factor weights showing how frequently the different variants of your dependent variable appear in various contexts. Although you could do counts and percentages in a spreadsheet program like Excel, Goldvarb allows you to go one step further to a multivariate analysis. These allow you to see how much effect each independent variable (aspects of the context: linguistic, social, and stylistic) has on the dependent variable (the phenomenon you’re studying).
Download Goldvarb. It is available for Mac, Windows, or Linux. See link in Blackboard or download directly from:
http://individual.utoronto.ca/tagliamonte/goldvarb.htmGoldvarb requires the code for each token to be enclosed between a left parenthesis “(“ and some white space. So, to easily create a token file that is formatted appropriately, add the following formula to the first blank cell to the right of your first coded token in your Excel spreadsheet: =”(“&C2&D2&F2&E2&A2&” “&B2. (Between the two double quotes that look adjacent on this webpage, you should type 3 spaces.) Be sure to type this formula into your Spreadsheet rather than copying it from the webpage. Apparently there are “issues” with the quotation marks otherwise.
Goldvarb also can only handle codes that are a single character. So be sure to change your speaker codes to something like the first letter of each speaker's name (rather than 2- or 3-digit numbers).
Your spreadsheet should now look like this:
A B C D E F G H 1 Speaker Token Form of GE Noun cat. Type of Conj. Lenngth of GE Token formula Token formula 2 b I bought cookies and chocolates and stuff. S C A S (SCASb I bought cookies and chocolates and stuff. ="("&C2&D2&E2&F2&A2&" "&B2 3 b The students talked about homework and stress and things like that. T M A L (TMALb The students talked about homework and stress and things like that. Note: Here, cell H2 above shows the formula that you should type in. The cells in Column G show what it will produce in this table. 4 b And then my mom was like, “You are having too much fun and all." X O A L (XOALb And then my mom was like, “You are having too much fun and all." This will create an appropriately formatted token in the cell where you typed this function.
Copy this formula down the full column so that you have each token formatted this way.
Copy only this column into a New Token file in Goldvarb. To do this:
Prepare the token file
Open Goldvarb
Select "New" in the "File" menu.
Add ".tkn" as a suffix to whatever title you choose.
Select "Tokens" as the type of new file.
When it asks you to select number of groups, type the number of elements you will have in each token (4). Then hit return or "OK". You can always change the number of elements, so just click "OK" and go on if you aren't sure.
Enter your tokens, one per line. You will easily do this by pasting in the column of formatted tokens from your Excel spreadsheet.
In general:
Each token line must begin with an open parenthesis "(".
Separate the token from following material by at least 3 spaces or a tab.
Anything in a line that doesn't begin with "(" will be ignored by the program, so you can label different parts of your file by writing whatever you want on a line that doesn't begin with "(".
You can also add any comments, to be ignored by the program but useful to humans, by starting the line with a semicolon “;”. You might wish to add a comment line indicating where your second speaker’s tokens begin, for example. Or you might add a comment so you can easily find your favorite token.
FYI, there is a "search & replace" command in the "Tokens" menu which you can use to automate repetitive tasks. For example, assume every line needs to have a "N" as the second element of the token (representing the speaker "Naomi", and you have used "y" and "n" as the first element of your token. Select "search & replace" and replace each "y" with "yN" and then each "n" with "nN".
FYI, You can cut and paste to and from a token file for editing, just like in Word.
Save the token file. Name it LIN351_YourLastName.tkn
Check your token file.
In the Token menu, choose "Generate factor specifications." This will make a list of all the characters you used in each column. You can see these in the little window below your token file. Click through the factor groups and make sure there are no anomalous characters (likely indicating typos or missing elements in a token).
Alternatively, you can enter the factor specifications into the "Factor specification" window and then select "Check tokens" at the program will look for lines that have an anomalous character (i.e., one that you didn't specify for that group.)
If it asks you to "Set fill character," just type "/" and say ok. That means that if you have any token string that isn't long enough (you specified the length at the beginning with "Select number of groups") it will fill in "/"'s to fill out the line-- then you'll see them and check what you missed.
[Return to top] [Return to syllabus]
Part 7: Distributional analysis using Goldvarb
First, make sure your Token file (from Part 6) is open in Goldvarb.Prepare the Conditions file
This is where you choose how to sort your data. For starters, you do a general sort of all your data, to show the distribution of each dependent variable with respect to each variant of the independent variable.
In the Token menu, choose "No recode." This will give you a general overview of the tokens and patterns you have.
Save your new Conditions file.
Name it something that will make sense like "all" or "first" or "Vanessa."
Add the suffix ".cnd" to the name.
Note that the program suggests an appropriate name, but it will always suggest a name that is the same as your token file name, and you will probably make several different condition files from your token file.Watch it generate a list of conditions, written in Lisp programming language. Your condition file will look something like this:
(
; Identity recode: All groups included as is.
(1)
(2)
(3)
)
This means: "Didn't do anything to any of the groups. Just use them all (elements (1), (2) and (3) of each token) as they are, with the stuff in column (1) as the dependent variable.
Create cell and result files
In the "Cell" menu select "Load cells to memory."
Click "OK" when it asks whether to use the tokens and condition files that you see on the screen.
This won't work if there is anything wrong with your token file or conditions file.
A cell file is created, which you can ignore.
A Results file is also created.
You will be asked to select the application values. This means, "how will the dependent variable be examined?" The possible variants of the dependent variable are listed. You can rearrange their order and/or erase some of them. Assume the window shows you the string "YN?".
If you select "Y" it will do a binary comparison, comparing tokens coded as "Y" for the dependent variable to all tokens with any other variant.
If you select "YN" it will do a binary comparison, comparing tokens coded with "Y" for the dependent variable to tokens coded with "N", and ignoring any tokens with other variants (e.g., those coded with "?").
If you select 3 or more characters, all tokens with those codes for the dependent variable will be examined, and the others ignored.
For a first run-through, select the whole string, but put them in an order with the more relevant ones first. (i.e., put "X" at the end as you won't get much information from it.
To go on to the statistical analysis, you must select one of the binary comparison options (listing either one or two variants).
Save the Results file under an appropriate name.
The Results file
This file shows you the distribution of the dependent variable with respect to each variant of the independent variables. It looks like this:
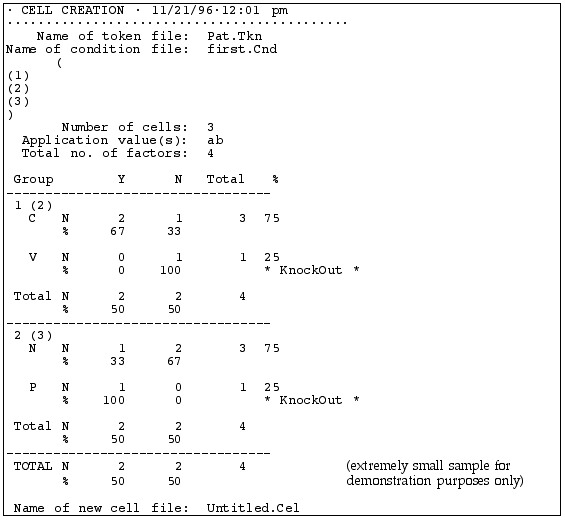 |
When you created it |
| . tkn and .cnd files uses | |
| Conditions you selected | |
| Summary of the distribution | |
| Details of the distribution of variants of the dependent variable (listed across the top) for each independent variable (listed along the left side) |
This table lists the possible variants of the independent variable (Y and N) across the top of the table and the possible variants of each dependent variable, one per row. So this Results file compares tokens with "Y" vs. "N" as the independent variable, i.e., deleted vs. non-deleted (t,d). Note: You will not use “Y” and “N” for your dependent variable.
The first independent variable examined is following segment, with "C" for following consonant and "V" for following vowel. It shows that 67% of the words with a following consonant had deleted (t,d), but 0% of the words with a following vowel had deleted (t,d).
The second independent variable examined is Speaker, with "P" for Pat and "N" for Naomi (pseudonyms, of course). We see that Speaker N deleted (t,d) in 33% of her tokens and Speaker P in 100%
The word * KnockOut * appears in every line that has a "0" in it.
Finally, we see that overall, for the whole token set, (t,d) deletion occurred 50% of the time, or in 2 out of 4 tokens.
Note: You can copy and paste this table into a Word document, such as a research paper. The columns will line up if you choose the Courier font. It will have strings of spaces rather than tabs, which can be a pain to edit, but you can fix it up as necessary. You can also edit it right in the Results window, which can be dangerous. But, if you do mess it up, you can also reconstruct a new results file by going back to the "Cell" menu and selecting "Load cells to memory."
[Return to top] [Return to syllabus
Part 8: Report the overall distribution of GEs in the data
Provide an overall distribution of GEs in the data, as per the following template. Label it ‘Table 1':
| GENERAL EXTENDERS | All speakers | |
|---|---|---|
% |
N |
|
| thing | 34 |
428 |
| stuff | 20 |
255 |
| something | 16 |
199 |
| everything | 11 |
140 |
| anything | 15 |
189 |
| whatever | 0 |
1 |
| Other | 1 |
15 |
TOTAL | 1,267 |
Note: the numbers in these table templates are made up! You will have to replace them with your own numbers and your own categories, depending on what you find in your data.
While you were asked to extract all GEs in Parts 1–4 and include them in your appendix, for the distributional analysis, it is sometimes better to collapse some categories, such as putting the less frequent GEs into an “other” or “miscellaneous” category. Clearly indicate what has been included in each category, including the collapsed categories.
See Tagliamonte & Denis (2010: 347) (Table 5) for a model of (a very detailed version of) this table.
Provide a distributional analysis of GEs by speaker, as per the following template. Label it ‘Table 2’. Be sure to indicate which speaker (e.g., [017] or [022]) is in each column, for all of these tables. You may either label the columns with the original speaker codes, or with the 1-digit codes provided above, or with your own 1-digit codes. If you use your own set of codes, you must provide a key linking your codes to the original ones.
| GENERAL EXTENDERS | Speaker 1 [017] |
Speaker 2... [022] |
||
|---|---|---|---|---|
% |
N |
% |
N |
|
| thing | 31 |
209 |
34 |
428 |
| stuff | 18 |
120 |
20 |
255 |
| something | 18 |
120 |
16 |
199 |
| everything | 18 |
123 |
11 |
140 |
| anything | 10 |
66 |
15 |
189 |
| whatever | 0 |
1 |
0 |
1 |
| Other | 2 |
10 |
1 |
15 |
| Miscellaneous | 2 |
16 |
3 |
40 |
| TOTAL | 665 |
612 |
||
Again, collapse categories as necessary.
Provide a distributional analysis of only the GEs stuff and things by Noun category, as per the following template. Label your table for stuff ‘Table 3.’ Label your table for things ‘Table 4.’
| Context | Speaker 1 [017] | Speaker 2 [022] ... | ||||
|---|---|---|---|---|---|---|
% stuff of total # of GEs |
N (Total # stuff) |
N = Total # of GEs with this noun type |
% stuff of total # of GEs |
N (Total # stuff) |
N = Total # of GEs with this noun type |
|
| mass nouns | 17 |
1 |
6 |
100 |
2 |
2 |
| count nouns | 2 |
1 |
53 |
71 |
25 |
35 |
| TOTAL | 2 |
59 |
27 |
37 |
||
| Context | Speaker 1 [017] | Speaker 2 [022] ... | ||||
|---|---|---|---|---|---|---|
% things of total # of GEs |
N (Total # things ) |
N = Total # of GEs with this noun type |
% things of total # of GEs |
N (Total # things ) |
N = Total # of GEs with this noun type |
|
| mass nouns | 17 |
1 |
6 |
100 |
2 |
2 |
| count nouns | 2 |
1 |
53 |
71 |
25 |
35 |
| TOTAL | 2 |
59 |
27 |
37 |
||
For these tables, you will again probably not want to include all the categories that you found when you were extracting and coding the data. Using the results reported in Tagliamonte & Denis (2010) as a model (since you are comparing your results to theirs for the comparative analysis in Part 10 ), you will need to decide which categories should be collapsed, and which categories might need to be ignored altogether in your tables.
Remember that for Table 3, you are reporting the results only for the stuff GEs (and for Table 4 it's only for things)!! You might want to look ahead to the instructions for doing "cross-tabs" to make this easier.
Submit Tables 1-4 as well as a print-out of your Goldvarb .Res file (for Part 8).
Note: If you don't have a printer and GoldVarb on the same computer, you may need to COPY the contents of your Results file to a Word .doc or some such, save it, and take/send it to a computer w/ printer. (Because you won't be able to easily open a .Res file on a computer where Goldvarb isn't installed.)
So, far, you have been doing univariate analysis – looking at only one independent variable at a time. In the next Part, you will learn to how to conduct an analysis with more than one independent variable included. This is very important when your data set does not have a balanced distribution of every combination of every independent variable. That is, when you are dealing with real world data.
[Return to top] [Return to syllabus]
Part 9: Factor Weights
Preparing for multivariate analysis
For this part of the project, you want to conduct an analysis that examines the tokens from all speakers together. Thus, you need to create and use a token file that has the tokens for all six speakers in it, and a column with a (single character!) code that identifies which speaker produced that token.
Use 'stuff' as the application value. I recommend an analysis which contrasts 'stuff' to all the other GEs combined, but you can experiment with different approaches. Be sure to label what is being counted, in your tables.
In order to find out which variables are significant, you must create a results file with no "Knockouts, " i.e., no "0"'s. This may mean combining or deleting certain factors or factor groups. This process is done by creating a new Conditions file.
Make sure you have principled reasons for the changes you make. This means that it's ok to combine following stop and following fricative if there was 95% deletion for stops and 100% for fricatives, because (a) stops and fricative are somewhat similar phonetically and (b) the numbers were fairly similar.
Select "Recode setup" from the "Tokens" menu. First, copy over the dependent variable from the left to the right side, using the "Copy" button. Then, for any factor groups that you wish to leave intact, select them on the left side (clicking on their factor group number) and then click "Copy."
To exclude a certain factor, click on it on the left side, then click "Exclude" and say "ok." Then copy the factor group. The excluded token will still show up, but tokens containing it will be ignored in the analysis.
To recode a factor group, select it, choose recode, and then type over the letters on the right to show how you want to recode them.
Make sure it worked.
Do this by going back to the "Create cells" step and creating the distribution tables again and making sure that there are no knock-outs. If it didn't work, try a new condition file. This may get tedious, so you might copy down your coding from the Conditions window. You should be able to figure out most of the Lisp code.See more information in the "How to recode" document in Bb (or download here; you'll need the sample .tkn file, too).
Multivariate analysis
Choose "Binomial, one-level" from the "Cells" menu.
This will create a table showing the weights of each factor. It looks like all the tables of weights and probabilities you've seen in various articles. The weights are the values for p1, p2, etc., in the logistic equations we looked at, representing the effect that each factor has on whether the rule applies. (The factor weights are for the "Application value," which is whichever value of the dependent variable prints in the first column of the distribution table that you will have just made.)
It will also show the frequency of each factor, for that same Application value.It also gives an Input value, which is the overall probability (po) of the application value occurring.
So for any one combination of factors (e.g., following consonant, Pat as speaker) we could calculate the probability of deletion by combining the po value with the appropriate p1, p2, for each factor group.) But, we don't have to do it because Goldvarb does it for us-- those weights combined will equal the probability of a certain type of token undergoing the rule application.
Choose "Binomial, up & down" for analysis of which factors are significant. (You don't need to do this step for the assignment. It's more relevant when you have more factors.)
This analysis takes longer than the one-level, if you have a big token file.
It spits out a lot of text and numbers, but indicates which factors are significant.
You will notice that, generally, the factor groups it finds to be significant are those that have the biggest spread in values in the one-level analysis. If there is a lot of overlap between two different factor groups (i.e., all tokens with a following vowel having been produced by Pat), there may be differences.
Cross-tabulation
If you want to look for that type of overlap, or any interaction between 2 independent variables, choose "Cross-tab" from the Cells menu and select the 2 groups you are interested in. A new table will be created which shows you their distribution. You can save it as Text or Picture. The "Picture" one looks nicer when copied into another document, but can't be edited, and takes up more disk space. The "Text" one can be edited, and has to be, in order to be legible. Use Courier font to make the columns line up.
For this Part, submit a document containing Results file for a one-level analysis for all speakers combined, as Table 5. Be sure to label all columns and rows clearly. It should be arranged like Factor Weight tables we've seen in a number of articles this semester.
See the note above about printing issues.
[Return to top] [Return to syllabus]
Part 10: Comparative analysis
Submit a brief report (1-2 pages of prose) answering the following questions. Include the necessary tables from your own analysis, clearly labeled.
1) Compare your results with the results presented in Dines (1980) and Tagliamonte & Denis (2010). What’s the same? What’s different?
As you do this, think about things like:
How might the age of the speakers be relevant , and how do they compare with their age-mates in the published studies?
What GEs are favoured in by each age group?
How does the proportion of and stuff for the variants of the different independent variables compare between the speakers? Is this similar or different to what Tagliamonte & Denis observed? If it’s different, what could explain the differences?
NOTE: The various files shown as examples are nonsense, un-related, and/or not created from real data.
[Return to top] [Return to syllabus]
Updated March 29, 2011