The bispectrum is a tool for analyzing signals. While the power spectrum of a signal breaks down the power of a signal by its frequency, the bispectrum provides information regarding specific interactions between the various frequency components of a signal. What can this tell us? Various sources, such as Wikipedia, researchers in Japan and the UK, and academic articles say that the bispectrum can tell us about the nonlinear interactions in a process that generates a signal. These are great articles – full of precise mathematics and deep technical detail. But after reading these sources, I don’t understand, on a simple and intuitive level, how the bispectrum of a signal really represents a signal.
Various web searches did not reveal sources with a truly intuitive explanation. Maybe the bispectrum can’t be explained or demonstrated in simple terms at all – math might very well be the only way to communicate the concept. But it looks like no one has really tried to explain what the bispectrum is in a simple manner. I must not be the first person who has faced the bispectrum and felt that the mathematical definition leaves more to be desired. The bispectrum appears to live in an academic world. My goal with this project is to bring the concept of the bispectrum within both conceptual and practical reach of a wider audience.
Show, don’t tell
The mathematical definition of the bispecrtum is like a recipe – it defines the operations necessary to produce a bispectrum. It tells you what to do, and once you do it, you get a result that you can plot, and therefore see. Seeing is essential for understanding. So, I recorded an audio signal of myself saying “hello world” and plotted its bispectrum:
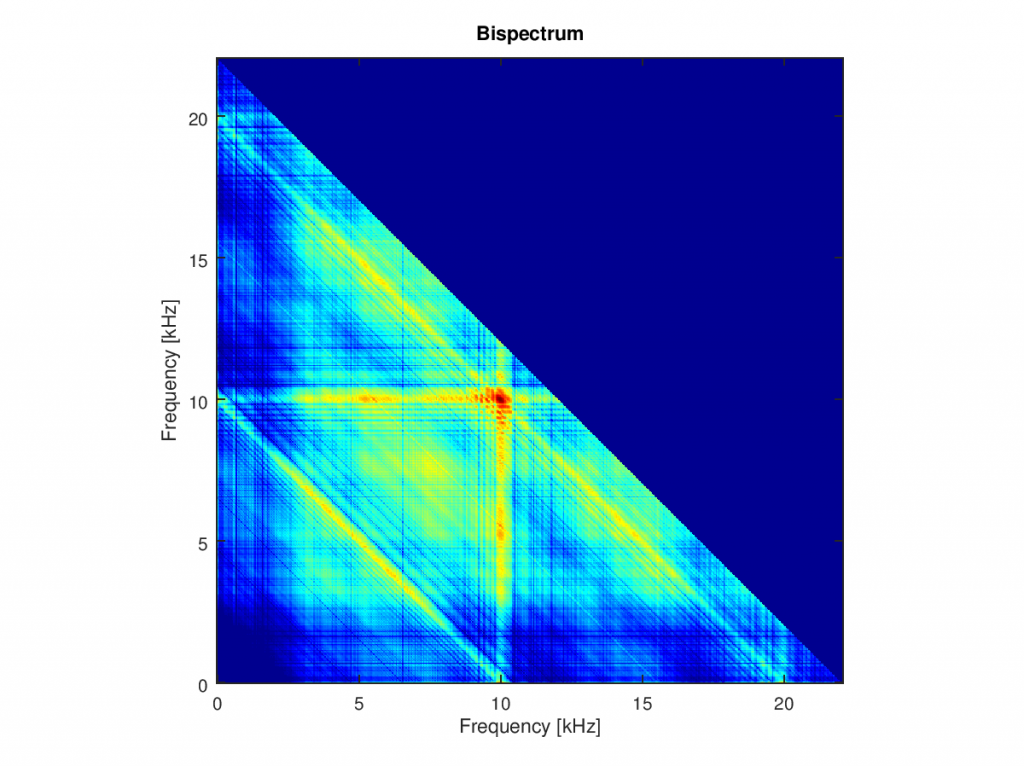
This helps a bit, but not much. What do those vertical and diagonal lines indicate? Is it a unique mark of my voice? What about those green puddles between the lines? I don’t know. It would be better if I had a way of quickly generating the bispectrum of various familiar sounds (signals). In particular, real-time generation of the bispectrum would help me develop an intuitive understanding of how a bispectrum represents sound. Then I might be able to go beyond the mathematical definition by showing what a bispectrum really represents.
Build a bispectrum visualizer
A portable instrument that rapidly and repeatedly computes and displays the bispectrum of real-world sounds would provide the best way, I think, to gain an appreciation of how the bispectrum represents a signal. Spectrum analyzers are commercial laboratory instruments that display the power spectrum of an electrical signal and have been built in the “homebrew” context by electronics hobbyists. So why not build my own bispectrum visualizer? (The name “bispectrum analyzer” is already taken by this software.)
Project goals
To build a standalone device with:
- A standard audio input connector
- Signal conditioning circuitry
- A microprocessor to repeatedly compute the bispectrum of the audio signal reasonably quickly
- A display to show the bispectrum
Looking ahead
Future posts will cover the system block diagram and circuit topology followed by detailed circuit design and component selection. Stay tuned for more!